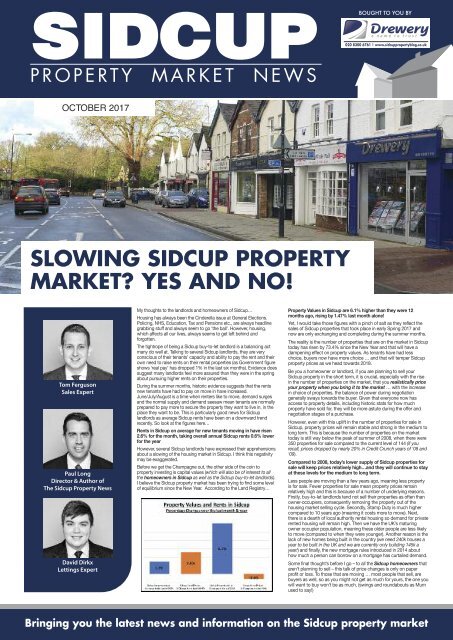
SIDCUP PROPERTY NEWS - OCTOBER 2017
Drewery Property Consultants Keeping you informed of properties available on the market and industry related articles.
Drewery Property Consultants Keeping you informed of properties available on the market and industry related articles.
You also want an ePaper? Increase the reach of your titles
YUMPU automatically turns print PDFs into web optimized ePapers that Google loves.
<strong>SIDCUP</strong><br />
P R O P E R T Y M A R K E T N E W S<br />
BOUGHT TO YOU BY<br />
020 8300 6761 | www.sidcuppropertyblog.co.uk<br />
<strong>OCTOBER</strong> <strong>2017</strong><br />
SLOWING <strong>SIDCUP</strong> <strong>PROPERTY</strong><br />
MARKET? YES AND NO!<br />
Tom Ferguson<br />
Sales Expert<br />
Paul Long<br />
Director & Author of<br />
The Sidcup Property News<br />
David Dirkx<br />
Lettings Expert<br />
My thoughts to the landlords and homeowners of Sidcup…<br />
Housing has always been the Cinderella issue at General Elections.<br />
Policing, NHS, Education, Tax and Pensions etc., are always headline<br />
grabbing stuff and always seem to go ‘the ball’. However, housing,<br />
which affects all our lives, always seems to get left behind and<br />
forgotten.<br />
The tightrope of being a Sidcup buy-to-let landlord is a balancing act<br />
many do well at. Talking to several Sidcup landlords, they are very<br />
conscious of their tenants’ capacity and ability to pay the rent and their<br />
own need to raise rents on their rental properties (as Government figure<br />
shows ‘real pay’ has dropped 1% in the last six months). Evidence does<br />
suggest many landlords feel more assured than they were in the spring<br />
about pursuing higher rents on their properties.<br />
During the summer months, historic evidence suggests that the rents<br />
new tenants have had to pay on move in have increased.<br />
June/July/August is a time when renters like to move, demand surges<br />
and the normal supply and demand seesaw mean tenants are normally<br />
prepared to pay more to secure the property they want to live in, in the<br />
place they want to be. This is particularly good news for Sidcup<br />
landlords as average Sidcup rents have been on a downward trend<br />
recently. So look at the figures here…<br />
Rents in Sidcup on average for new tenants moving in have risen<br />
2.6% for the month, taking overall annual Sidcup rents 0.6% lower<br />
for the year<br />
However, several Sidcup landlords have expressed their apprehensions<br />
about a slowing of the housing market in Sidcup. I think this negativity<br />
may be exaggerated.<br />
Before we get the Champagne out, the other side of the coin to<br />
property investing is capital values (which will also be of interest to all<br />
the homeowners in Sidcup as well as the Sidcup buy-to-let landlords).<br />
I believe the Sidcup property market has been trying to find some level<br />
of equilibrium since the New Year. According to the Land Registry…<br />
Property Values in Sidcup are 6.1% higher than they were 12<br />
months ago, rising by 1.47% last month alone!<br />
Yet, I would take those figures with a pinch of salt as they reflect the<br />
sales of Sidcup properties that took place in early Spring <strong>2017</strong> and<br />
now are only exchanging and completing during the summer months.<br />
The reality is the number of properties that are on the market in Sidcup<br />
today has risen by 73.4% since the New Year and that will have a<br />
dampening effect on property values. As tenants have had less<br />
choice, buyers now have more choice … and that will temper Sidcup<br />
property prices as we head towards 2018.<br />
Be you a homeowner or landlord, if you are planning to sell your<br />
Sidcup property in the short term, it is crucial, especially with the rise<br />
in the number of properties on the market, that you realistically price<br />
your property when you bring it to the market … with the increase<br />
in choice of properties, the balance of power during negotiation<br />
generally sways towards the buyer. Given that everyone now has<br />
access to property details, including historic stats for how much<br />
property have sold for, they will be more astute during the offer and<br />
negotiation stages of a purchase.<br />
However, even with this uplift in the number of properties for sale in<br />
Sidcup, property prices will remain stable and strong in the medium to<br />
long term. This is because the number of properties on the market<br />
today is still way below the peak of summer of 2008, when there were<br />
350 properties for sale compared to the current level of 144 (if you<br />
recall, prices dropped by nearly 20% in Credit Crunch years of ‘08 and<br />
‘09).<br />
Compared to 2008, today’s lower supply of Sidcup properties for<br />
sale will keep prices relatively high…and they will continue to stay<br />
at these levels for the medium to long term.<br />
Less people are moving than a few years ago, meaning less property<br />
is for sale. Fewer properties for sale mean property prices remain<br />
relatively high and this is because of a number of underlying reasons.<br />
Firstly, buy-to-let landlords tend not sell their properties as often than<br />
owner-occupiers, consequently removing the property out of the<br />
housing market selling cycle. Secondly, Stamp Duty is much higher<br />
compared to 10 years ago (meaning it costs more to move). Next,<br />
there is a dearth of local authority rental housing so demand for private<br />
rented housing will remain high. Then we have the UK’s maturing<br />
owner occupier population, meaning these older people are less likely<br />
to move (compared to when they were younger). Another reason is the<br />
lack of new homes being built in the country (we need 240k houses a<br />
year to be built in the UK and we are currently only building 145k a<br />
year!) and finally, the new mortgage rules introduced in 2014 about<br />
how much a person can borrow on a mortgage has curtailed demand.<br />
Some final thought’s before I go – to all the Sidcup homeowners that<br />
aren’t planning to sell – this talk of price changes is only on paper<br />
profit or loss. To those that are moving … most people that sell, are<br />
buyers as well, so as you might not get as much for yours, the one you<br />
will want to buy won’t be as much, (swings and roundabouts as Mum<br />
used to say!)<br />
Bringing you the latest news and information on the Sidcup property market
LATEST <strong>SIDCUP</strong> BUY-TO-LET RETURN /<br />
YIELDS – 2.8% TO 7.04% A YEAR<br />
The mind-set and tactics you employ to buy your first Sidcup<br />
buy to let property needs to be different to the tactics and<br />
methodology of buying a home for yourself to live in. The main<br />
difference is when purchasing your own property, you may well<br />
pay a little more to get the home you (and your family) want, and<br />
are less likely to compromise. When buying for your own use, it<br />
is only human nature you will want the best, so that quite often it<br />
is at the top end of your budget (because as my parents always<br />
used to tell me – you get what you pay for in this world!).<br />
Yet with a buy to let property, if your goal is a higher rental return<br />
– a higher price doesn’t always equate to higher monthly returns<br />
– in fact quite the opposite. Inexpensive Sidcup properties can<br />
bring in bigger monthly returns. Most landlords use the phrase<br />
‘yield’ instead of monthly return. To calculate the yield on a buy<br />
to let property one basically takes the monthly rent, multiplies it<br />
by 12 to get the annual rent and then divides it by the value of<br />
the property.<br />
This means, if one increases the value of the property using this<br />
calculation, the subsequent yield drops. Or to put it another<br />
way, if a Sidcup buy to let landlord has the decision of two<br />
properties that create the same amount of monthly rent, the<br />
landlord can increase their rental yield by selecting the lower<br />
priced property.<br />
To give you an idea of the sort of returns in Sidcup…<br />
Now of course these are averages and there will always be<br />
properties outside the lower and upper ranges in yields: they are<br />
a fair representation of the gross yields you can expect in the<br />
Sidcup area.<br />
As we move forward, with the total amount of buy to let<br />
mortgages amounting to £199,310,614,000 in the country,<br />
landlords need to be aware of the investment performance of<br />
their property, especially in the era of tax increases and tax relief<br />
reductions. Landlords are looking to maximise their yield – and<br />
are doing so by buying cheaper properties.<br />
However, before everyone in Sidcup starts selling their upmarket<br />
properties and buying cheap ones, yield isn’t the only factor<br />
when deciding on what Sidcup buy to let property to buy. Void<br />
periods (i.e. the time when there isn’t a tenant in the property<br />
between tenancies) are an important factor and those properties<br />
at the cheaper end of the rental spectrum can suffer higher void<br />
periods too. Apartments can also have service charges and<br />
ground rents that aren’t accounted for in these gross yields.<br />
Landlords can also make money if the value of the property<br />
goes up and for those Sidcup landlords who are looking for<br />
capital growth, an altered investment strategy may be required.<br />
In Sidcup, for example, over the last 20 years, this is how the<br />
average price paid for the four different types of Sidcup property<br />
have changed…<br />
• Sidcup Detached Properties have increased in value by<br />
287.2%<br />
• Sidcup Semi-Detached Properties have increased in value<br />
by 302.7%<br />
• Sidcup Terraced Properties have increased in value by<br />
282.2%<br />
• Sidcup Apartments have increased in value by 280.1%<br />
It is very much a balancing act of yield, capital growth and void<br />
periods when buying in Sidcup. Every landlord’s investment<br />
strategy is unique to them. If you would like a fresh pair of eyes<br />
to look at your portfolio, be you a private landlord that doesn’t<br />
use a letting agent or a landlord that uses one of my<br />
competitors – then feel free to drop in and let’s have a chat.<br />
What have you got to lose?<br />
Current Average Asking Prices in Sidcup<br />
LETTINGS ADMINISTRATOR<br />
(Part Time considered)<br />
Varied and interesting position for a competent, enthusiastic<br />
person with good computer, communication & organisational skills<br />
Enquiries/CV please to: Erica Lewis<br />
e.lewis@drewery.co.uk<br />
128 Station Road, Sidcup DA15 7AF<br />
Tel 0208 269 6608<br />
1<br />
BED<br />
FLAT<br />
£265,923<br />
2<br />
BED<br />
FLAT<br />
£332,386<br />
data from zoopla.co.uk using current properties being marketed<br />
2<br />
BED<br />
HOUSE<br />
£361,921<br />
3<br />
BED<br />
HOUSE<br />
£444,370<br />
4<br />
BED<br />
HOUSE<br />
£592,515<br />
For more Sidcup Property News visit: www.sidcuppropertyblog.co.uk
33.6% DROP IN <strong>SIDCUP</strong> PEOPLE<br />
MOVING HOME IN THE LAST 10 YEARS<br />
I was having a lazy Saturday morning, reading through the newspapers at my favourite<br />
coffee shop in Sidcup. I find the most interesting bits are their commentaries on the<br />
British Housing Market. Some talk about property prices, whilst others discuss the<br />
younger generation grappling to get a foot-hold on the property ladder with difficulties of<br />
saving up for the deposit. Others feature articles about the severe lack of new homes<br />
being built. A group of people that don’t often get any column inches however are those<br />
existing homeowners who can’t move!<br />
Back in the early 2000’s, between 1m and 1.3m people moved each year in England and<br />
Wales, peaking at 1,349,306 home-moves (i.e. house sales) in 2002. However, the ‘credit<br />
crunch’ hit in 2008 and the number of house sales fell to 624,994 in 2009. Since then<br />
this has steadily recovered, albeit to a more ‘respectable’ 899,708 properties by 2016.<br />
This means there are around 450,000 fewer house sales (house-moves) each year<br />
compared to the noughties. The question is … why are there fewer house sales?<br />
To answer that, we need to go back 50 years. Inflation was high in the late 1960’s, 70’s<br />
and early 80’s. To combat this, the Government raised interest rates to a high level in a<br />
bid to lower inflation. Higher interest rates meant the householders monthly mortgage<br />
payments were higher, meaning mortgages took a large proportion of the homeowner’s<br />
household budget. However, this wasn’t all bad news since inflation tends to erode<br />
mortgage debt in ‘real spending power terms’. Consequently, as wages grew (to keep up<br />
with inflation), this allowed home owners to get even bigger mortgages. At the same<br />
time their mortgage debt was decreasing, therefore allowing them to move up the<br />
property ladder quicker.<br />
Roll the clock on to the late 1990’s and the early Noughties, and things had changed. UK<br />
interest rates tumbled as UK inflation dropped. Lower interest rates and low inflation,<br />
especially in the five years 2000 to 2005, meant we saw double digit growth in the value<br />
of UK property. This inevitably meant all the home owner’s equity grew significantly,<br />
meaning people could continue to move up the property ladder (even without the effects<br />
of inflation).<br />
This snowball effect of significant numbers moving house continued into the mid<br />
noughties (2004 to 2007), as Banks and Building Society’s slackened their lending<br />
criteria. [You will probably remember the 125% loan to value Northern Rock Mortgages<br />
that could be obtained with just a note from your Mum!!]. This meant home movers could<br />
borrow even more to move up the property ladder.<br />
So, now it’s <strong>2017</strong> and things have changed yet again!<br />
You would think that with ultra-low interest rates at 0.25% (a 320-year low) the number of<br />
people moving would be booming – wouldn’t you? However, this has not been the case.<br />
Less people are moving because:<br />
(1) low wage growth of 1.1% per annum<br />
(2) the tougher mortgage rules since 2014<br />
(3) sporadic property price growth in the last few years<br />
(4) high property values comparative to salaries (I talked about this a couple of months<br />
ago)<br />
What does this translate to in pure numbers locally?<br />
In 2007, 5,051 properties sold in the London Borough of Bexley Council area and<br />
last year, in 2016 only 3,350 properties sold – a drop of 33.68%.<br />
Therefore, we have just over 1,700 less households moving in the Sidcup and<br />
surrounding Council area each year. Now of that number, it is recognised throughout the<br />
property industry around fourth fifths of them are homeowners with a mortgage. That<br />
means there are around 1,395 mortgaged households a year (fourth fifths of the figure of<br />
1,700) in the Sidcup and surrounding council area that would have moved 10 years ago,<br />
but won’t this year.<br />
The reason they can’t/won’t move can be split down into different categories, explained<br />
in a recent report by the Council of Mortgage Lenders (CML). So, of those estimated<br />
1,395 annual Sidcup (and surrounding area) non-movers, based on that CML report –<br />
1. There are around 502 households a year that aren’t moving due to a fall in the number<br />
of mortgaged owner occupiers (e. demographics).<br />
2. I then estimate another 195 households a year are of the older generation mortgaged<br />
owner occupiers. As they are increasingly getting older, older people don’t tend to<br />
move, regardless of what is happening to the property market (e. lifestyle).<br />
3. Then, I estimate 84 households of our Sidcup (and surrounding area) annual nonmovers<br />
will mirror the rising number of high equity owner occupiers, who previously<br />
would have moved with a mortgage but now move as cash buyers (e. high house<br />
price growth).<br />
4. I believe there are 614 Sidcup (and surrounding area) mortgaged homeowners that are<br />
unable to move because of the financing of the new mortgage or keeping within the<br />
new rules of mortgage affordability that came into play in 2014 (e. mortgage).<br />
The first three above are beyond the Government or Bank of England control. However<br />
could there be some influence exerted to help the non-movers because of financing the<br />
new mortgage and keeping within the new rules of mortgage affordability? If Sidcup<br />
property values were lower, this would decrease the size of each step up the property<br />
ladder. This would mean the opportunity cost of increasing their mortgage would reduce<br />
(i.e. opportunity cost = the step up in their mortgage payments between their existing and<br />
future new mortgage) and they would be able to move to more upmarket properties.<br />
Then there is the mortgage rules, but before we all start demanding a relaxation in<br />
lending criteria for the banks, do we want to return to free and easy mortgages 125%<br />
Northern Rock footloose and fancy-free mortgage lending that seemed to be available in<br />
the mid 2000’s … available at a drop of hat and three tokens from a cereal packet?<br />
We all know what happened with Northern Rock …. Your thoughts would be welcome on<br />
this topic.<br />
Current Average Asking Rents in Sidcup<br />
1<br />
BED<br />
FLAT<br />
£907pcm<br />
2<br />
BED<br />
FLAT<br />
£1,096pcm<br />
data from zoopla.co.uk using current properties being marketed<br />
2<br />
BED<br />
HOUSE<br />
£1,274pcm<br />
3<br />
BED<br />
HOUSE<br />
£1,331pcm<br />
4<br />
BED<br />
HOUSE<br />
£1,426pcm<br />
For more Sidcup Property News visit: www.sidcuppropertyblog.co.uk
»¾±»ˆ¾ÈÝø~ÍÈs¤Â±øs«„È–˜Â˜Â¾Í˜s¤‘±¾ÍÂøÈ–ˆÝ–sÖˆ»¾s˜Âˆ„±Í¾–±«ˆÂÈÝýffvs¤¤’ˆ«ÈÂü±üÍ¢vs×s¾„Âv‘±¾vÍÂȱªˆ¾vˆÜ»ˆ¾˜ˆ«ˆ<br />
»¾s˜Âˆ„±Í¾ˆÜ»ˆ¾˜ˆ«ˆs«„»sȘˆ«ˆ˜«–ˆ¤»˜«’È–ˆªÈ±Âˆ¤¤±¾»Í¾–sˆs<br />
c?Uv PUv? cL22v PUUv<br />
9Uv& 9v0 9Uvê èéîv<br />
„ˆÈˆ¾ª˜«ˆ„~ÝÈ–ˆ»Í~¤˜È–¾±Í’–±«¤˜«ˆ‘ˆˆ„~s¢‘¾±ª¤˜ˆ«È¾sȘ«’Âs«„<br />
È–¾±Í’–È–ˆÂ–s¾˜«’±‘ÍÂȱªˆ¾Âˆ¾Ö˜ˆˆÜ»ˆ¾˜ˆ«ˆÂý8s«Ý¤˜ˆ«È–sÖˆ<br />
Isͤv2±«’vm˜¾ˆÈ±¾v‰vÍÈ–±¾v±‘vU–ˆvP˜„Í»vI¾±»ˆ¾ÈÝv9ˆ×Âü<br />
v«sªˆvȱvȾÍÂÈṽ«v»¾±»ˆ¾ÈÝv˜«ˆvéñìîvffd–sȪs¢ˆÂÍ»s¾È˜Í¤s¾¤Ý»¤ˆsˆ„s~±Íȱ;s×s¾„˜ÂÈ–sÈÈ–ˆ×˜««ˆ¾˜Â


