Abacus Property Group – Securityholder Review 2017
Abacus Property Group – Securityholder Review 2017
Abacus Property Group – Securityholder Review 2017
- No tags were found...

You also want an ePaper? Increase the reach of your titles
YUMPU automatically turns print PDFs into web optimized ePapers that Google loves.
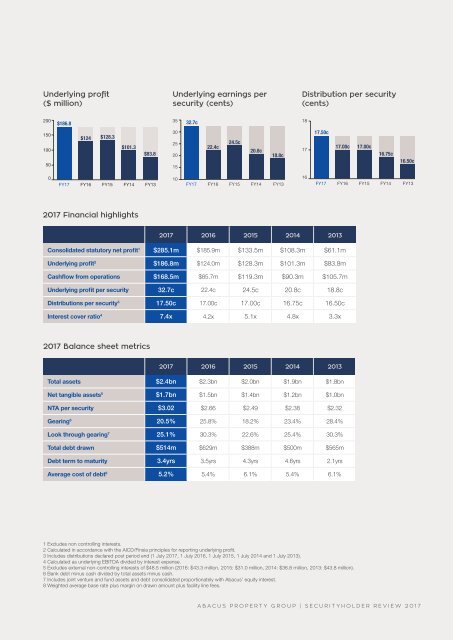
Underlying profit<br />
($ million)<br />
Underlying earnings per<br />
security (cents)<br />
Distribution per security<br />
(cents)<br />
200<br />
150<br />
100<br />
50<br />
$186.8<br />
$124<br />
$128.3<br />
$101.3<br />
$83.8<br />
35<br />
30<br />
25<br />
20<br />
15<br />
32.7c<br />
22.4c<br />
24.5c<br />
20.8c<br />
18.8c<br />
18<br />
17<br />
17.50c<br />
17.00c 17.00c<br />
16.75c<br />
16.50c<br />
0<br />
FY17 FY16 FY15 FY14 FY13<br />
10<br />
FY17 FY16 FY15 FY14 FY13<br />
16<br />
FY17 FY16 FY15 FY14 FY13<br />
<strong>2017</strong> Financial highlights<br />
<strong>2017</strong> 2016 2015 2014 2013<br />
Consolidated statutory net profit 1 $285.1m $185.9m $133.5m $108.3m $61.1m<br />
Underlying profit 2 $186.8m $124.0m $128.3m $101.3m $83.8m<br />
Cashflow from operations $168.5m $85.7m $119.3m $90.3m $105.7m<br />
Underlying profit per security 32.7c 22.4c 24.5c 20.8c 18.8c<br />
Distributions per security 3 17.50c 17.00c 17.00c 16.75c 16.50c<br />
Interest cover ratio 4 7.4x 4.2x 5.1x 4.8x 3.3x<br />
<strong>2017</strong> Balance sheet metrics<br />
<strong>2017</strong> 2016 2015 2014 2013<br />
Total assets $2.4bn $2.3bn $2.0bn $1.9bn $1.8bn<br />
Net tangible assets 5 $1.7bn $1.5bn $1.4bn $1.2bn $1.0bn<br />
NTA per security $3.02 $2.66 $2.49 $2.38 $2.32<br />
Gearing 6 20.5% 25.8% 18.2% 23.4% 28.4%<br />
Look through gearing 7 25.1% 30.3% 22.6% 25.4% 30.3%<br />
Total debt drawn $514m $629m $388m $500m $565m<br />
Debt term to maturity 3.4yrs 3.5yrs 4.3yrs 4.6yrs 2.1yrs<br />
Average cost of debt 8 5.2% 5.4% 6.1% 5.4% 6.1%<br />
1 Excludes non controlling interests.<br />
2 Calculated in accordance with the AICD/Finsia principles for reporting underlying profit.<br />
3 Includes distributions declared post period end (1 July <strong>2017</strong>, 1 July 2016, 1 July 2015, 1 July 2014 and 1 July 2013).<br />
4 Calculated as underlying EBITDA divided by interest expense.<br />
5 Excludes external non-controlling interests of $48.5 million (2016: $43.3 million, 2015: $31.0 million, 2014: $36.8 million, 2013: $43.8 million).<br />
6 Bank debt minus cash divided by total assets minus cash.<br />
7 Includes joint venture and fund assets and debt consolidated proportionately with <strong>Abacus</strong>’ equity interest.<br />
8 Weighted average base rate plus margin on drawn amount plus facility line fees.<br />
ABACUS PROPERTY GROUP | SECURITYHOLDER REVIEW <strong>2017</strong>