

Response of fermented Cladophora containing diet on growth performances and feed efficiency of Tilapia (Oreochromis sp.)
Abstract Feed is still contributed the highest in the cost of aquaculture. Fermented Cladophora was applied to replace plant-based protein for tilapia. Five different diets, but all are iso-protein, were formulated, substituting 0% (as control) to 40% of plant-based protein with fermented Cladophora. The experiment was set up using 15 aquaria, each of 30 l and stocked with tilapia (initial individual size of 3.65 ± 0.26 g) at density of 1 fish l-1. All the fish was fed at 3% of body-weight day-1 and the experiment was ended at day 42nd. The result showed that tilapia fed with 10% of fermented Cladophora reached the highest in growth rate, feed efficiency, protein digestibility, and essential amino acid index. The growth rate of this treatment was 30% higher than the control diet (non substitution with fermented Cladophora). This means that by changing ingredients in the diet, it may affect in cost reduction or gain in production biomass.
Abstract
Feed is still contributed the highest in the cost of aquaculture. Fermented Cladophora was applied to replace plant-based protein for tilapia. Five different diets, but all are iso-protein, were formulated, substituting 0% (as control) to 40% of plant-based protein with fermented Cladophora. The experiment was set up using 15 aquaria, each of 30 l and stocked with tilapia (initial individual size of 3.65 ± 0.26 g) at density of 1 fish l-1. All the fish was fed at 3% of body-weight day-1 and the experiment was ended at day 42nd. The result showed that tilapia fed with 10% of fermented Cladophora reached the highest in growth rate, feed efficiency, protein digestibility, and essential amino acid index. The growth rate of this treatment was 30% higher than the control diet (non substitution with fermented Cladophora). This means that by changing ingredients in the diet, it may affect in cost reduction or gain in production biomass.

You also want an ePaper? Increase the reach of your titles
YUMPU automatically turns print PDFs into web optimized ePapers that Google loves.
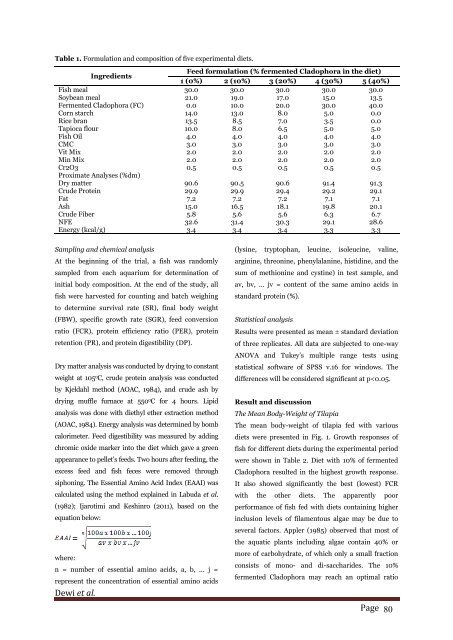
Table 1. Formulati<strong>on</strong> <strong>and</strong> compositi<strong>on</strong> <str<strong>on</strong>g>of</str<strong>on</strong>g> five experimental <str<strong>on</strong>g>diet</str<strong>on</strong>g>s.<br />
Ingredients<br />
Feed formulati<strong>on</strong> (% <str<strong>on</strong>g>fermented</str<strong>on</strong>g> <str<strong>on</strong>g>Cladophora</str<strong>on</strong>g> in the <str<strong>on</strong>g>diet</str<strong>on</strong>g>)<br />
1 (0%) 2 (10%) 3 (20%) 4 (30%) 5 (40%)<br />
Fish meal 30.0 30.0 30.0 30.0 30.0<br />
Soybean meal 21.0 19.0 17.0 15.0 13.5<br />
Fermented <str<strong>on</strong>g>Cladophora</str<strong>on</strong>g> (FC) 0.0 10.0 20.0 30.0 40.0<br />
Corn starch 14.0 13.0 8.0 5.0 0.0<br />
Rice bran 13.5 8.5 7.0 3.5 0.0<br />
Tapioca flour 10.0 8.0 6.5 5.0 5.0<br />
Fish Oil 4.0 4.0 4.0 4.0 4.0<br />
CMC 3.0 3.0 3.0 3.0 3.0<br />
Vit Mix 2.0 2.0 2.0 2.0 2.0<br />
Min Mix 2.0 2.0 2.0 2.0 2.0<br />
Cr2O3 0.5 0.5 0.5 0.5 0.5<br />
Proximate Analyses (%dm)<br />
Dry matter 90.6 90.5 90.6 91.4 91.3<br />
Crude Protein 29.9 29.9 29.4 29.2 29.1<br />
Fat 7.2 7.2 7.2 7.1 7.1<br />
Ash 15.0 16.5 18.1 19.8 20.1<br />
Crude Fiber 5.8 5.6 5.6 6.3 6.7<br />
NFE 32.6 31.4 30.3 29.1 28.6<br />
Energy (kcal/g) 3.4 3.4 3.4 3.3 3.3<br />
Sampling <strong>and</strong> chemical analysis<br />
At the beginning <str<strong>on</strong>g>of</str<strong>on</strong>g> the trial, a fish was r<strong>and</strong>omly<br />
sampled from each aquarium for determinati<strong>on</strong> <str<strong>on</strong>g>of</str<strong>on</strong>g><br />
initial body compositi<strong>on</strong>. At the end <str<strong>on</strong>g>of</str<strong>on</strong>g> the study, all<br />
fish were harvested for counting <strong>and</strong> batch weighing<br />
to determine survival rate (SR), final body weight<br />
(FBW), <strong>sp</strong>ecific <strong>growth</strong> rate (SGR), <strong>feed</strong> c<strong>on</strong>versi<strong>on</strong><br />
ratio (FCR), protein <strong>efficiency</strong> ratio (PER), protein<br />
retenti<strong>on</strong> (PR), <strong>and</strong> protein digestibility (DP).<br />
Dry matter analysis was c<strong>on</strong>ducted by drying to c<strong>on</strong>stant<br />
weight at 105 o C, crude protein analysis was c<strong>on</strong>ducted<br />
by Kjeldahl method (AOAC, 1984), <strong>and</strong> crude ash by<br />
drying muffle furnace at 550 o C for 4 hours. Lipid<br />
analysis was d<strong>on</strong>e with <str<strong>on</strong>g>diet</str<strong>on</strong>g>hyl ether extracti<strong>on</strong> method<br />
(AOAC, 1984). Energy analysis was determined by bomb<br />
calorimeter. Feed digestibility was measured by adding<br />
chromic oxide marker into the <str<strong>on</strong>g>diet</str<strong>on</strong>g> which gave a green<br />
appearance to pellet’s <strong>feed</strong>s. Two hours after <strong>feed</strong>ing, the<br />
excess <strong>feed</strong> <strong>and</strong> fish feces were removed through<br />
siph<strong>on</strong>ing. The Essential Amino Acid Index (EAAI) was<br />
calculated using the method explained in Labuda et al.<br />
(1982); Ijarotimi <strong>and</strong> Keshinro (2011), based <strong>on</strong> the<br />
equati<strong>on</strong> below:<br />
where:<br />
n = number <str<strong>on</strong>g>of</str<strong>on</strong>g> essential amino acids, a, b, ... j =<br />
represent the c<strong>on</strong>centrati<strong>on</strong> <str<strong>on</strong>g>of</str<strong>on</strong>g> essential amino acids<br />
Dewi et al.<br />
(lysine, tryptophan, leucine, isoleucine, valine,<br />
arginine, thre<strong>on</strong>ine, phenylalanine, histidine, <strong>and</strong> the<br />
sum <str<strong>on</strong>g>of</str<strong>on</strong>g> methi<strong>on</strong>ine <strong>and</strong> cystine) in test sample, <strong>and</strong><br />
av, bv, ... jv = c<strong>on</strong>tent <str<strong>on</strong>g>of</str<strong>on</strong>g> the same amino acids in<br />
st<strong>and</strong>ard protein (%).<br />
Statistical analysis<br />
Results were presented as mean st<strong>and</strong>ard deviati<strong>on</strong><br />
<str<strong>on</strong>g>of</str<strong>on</strong>g> three replicates. All data are subjected to <strong>on</strong>e-way<br />
ANOVA <strong>and</strong> Tukey’s multiple range tests using<br />
statistical s<str<strong>on</strong>g>of</str<strong>on</strong>g>tware <str<strong>on</strong>g>of</str<strong>on</strong>g> SPSS v.16 for windows. The<br />
differences will be c<strong>on</strong>sidered significant at p

![Review on: impact of seed rates and method of sowing on yield and yield related traits of Teff [Eragrostis teff (Zucc.) Trotter] | IJAAR @yumpu](https://documents.yumpu.com/000/066/025/853/c0a2f1eefa2ed71422e741fbc2b37a5fd6200cb1/6b7767675149533469736965546e4c6a4e57325054773d3d/4f6e6531383245617a537a49397878747846574858513d3d.jpg?AWSAccessKeyId=AKIAICNEWSPSEKTJ5M3Q&Expires=1718974800&Signature=EmkeD11GIHux3A5LYPXYoTzfyGA%3D)


