

compressed.tracemonkey-pldi-09

Create successful ePaper yourself
Turn your PDF publications into a flip-book with our unique Google optimized e-Paper software.
%#"<br />
%!"<br />
$#"<br />
&'()*+,"<br />
-./"<br />
01"<br />
$!"<br />
#"<br />
!"<br />
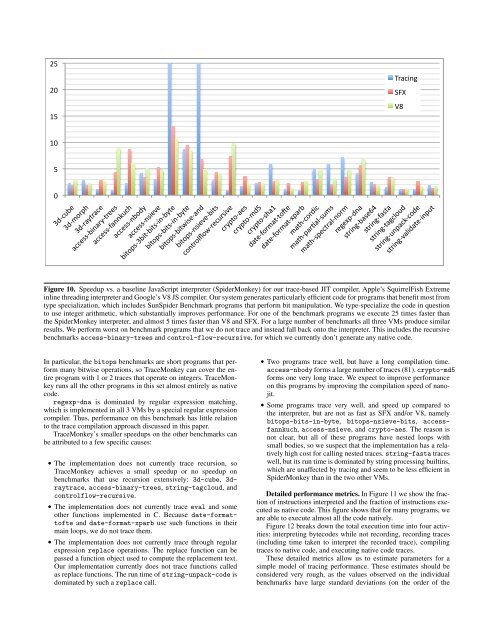
Figure 10. Speedup vs. a baseline JavaScript interpreter (SpiderMonkey) for our trace-based JIT compiler, Apple’s SquirrelFish Extreme<br />
inline threading interpreter and Google’s V8 JS compiler. Our system generates particularly efficient code for programs that benefit most from<br />
type specialization, which includes SunSpider Benchmark programs that perform bit manipulation. We type-specialize the code in question<br />
to use integer arithmetic, which substantially improves performance. For one of the benchmark programs we execute 25 times faster than<br />
the SpiderMonkey interpreter, and almost 5 times faster than V8 and SFX. For a large number of benchmarks all three VMs produce similar<br />
results. We perform worst on benchmark programs that we do not trace and instead fall back onto the interpreter. This includes the recursive<br />
benchmarks access-binary-trees and control-flow-recursive, for which we currently don’t generate any native code.<br />
In particular, the bitops benchmarks are short programs that perform<br />
many bitwise operations, so TraceMonkey can cover the entire<br />
program with 1 or 2 traces that operate on integers. TraceMonkey<br />
runs all the other programs in this set almost entirely as native<br />
code.<br />
regexp-dna is dominated by regular expression matching,<br />
which is implemented in all 3 VMs by a special regular expression<br />
compiler. Thus, performance on this benchmark has little relation<br />
to the trace compilation approach discussed in this paper.<br />
TraceMonkey’s smaller speedups on the other benchmarks can<br />
be attributed to a few specific causes:<br />
• The implementation does not currently trace recursion, so<br />
TraceMonkey achieves a small speedup or no speedup on<br />
benchmarks that use recursion extensively: 3d-cube, 3draytrace,<br />
access-binary-trees, string-tagcloud, and<br />
controlflow-recursive.<br />
• The implementation does not currently trace eval and some<br />
other functions implemented in C. Because date-formattofte<br />
and date-format-xparb use such functions in their<br />
main loops, we do not trace them.<br />
• The implementation does not currently trace through regular<br />
expression replace operations. The replace function can be<br />
passed a function object used to compute the replacement text.<br />
Our implementation currently does not trace functions called<br />
as replace functions. The run time of string-unpack-code is<br />
dominated by such a replace call.<br />
• Two programs trace well, but have a long compilation time.<br />
access-nbody forms a large number of traces (81). crypto-md5<br />
forms one very long trace. We expect to improve performance<br />
on this programs by improving the compilation speed of nanojit.<br />
• Some programs trace very well, and speed up compared to<br />
the interpreter, but are not as fast as SFX and/or V8, namely<br />
bitops-bits-in-byte, bitops-nsieve-bits, accessfannkuch,<br />
access-nsieve, and crypto-aes. The reason is<br />
not clear, but all of these programs have nested loops with<br />
small bodies, so we suspect that the implementation has a relatively<br />
high cost for calling nested traces. string-fasta traces<br />
well, but its run time is dominated by string processing builtins,<br />
which are unaffected by tracing and seem to be less efficient in<br />
SpiderMonkey than in the two other VMs.<br />
Detailed performance metrics. In Figure 11 we show the fraction<br />
of instructions interpreted and the fraction of instructions executed<br />
as native code. This figure shows that for many programs, we<br />
are able to execute almost all the code natively.<br />
Figure 12 breaks down the total execution time into four activities:<br />
interpreting bytecodes while not recording, recording traces<br />
(including time taken to interpret the recorded trace), compiling<br />
traces to native code, and executing native code traces.<br />
These detailed metrics allow us to estimate parameters for a<br />
simple model of tracing performance. These estimates should be<br />
considered very rough, as the values observed on the individual<br />
benchmarks have large standard deviations (on the order of the