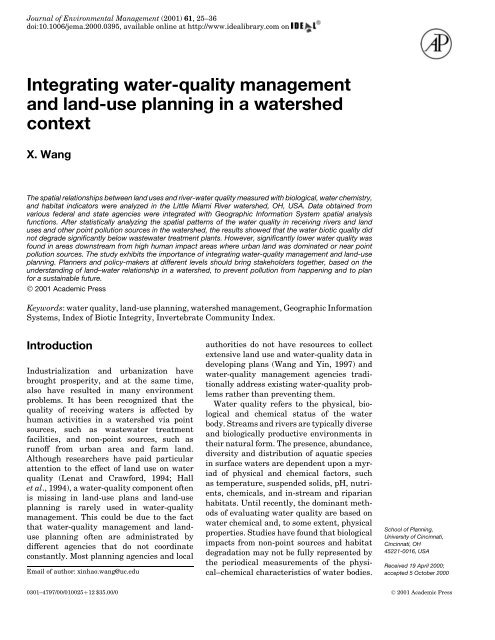
Integrating water quality management & landuse planning in a watershed context

You also want an ePaper? Increase the reach of your titles
YUMPU automatically turns print PDFs into web optimized ePapers that Google loves.
Journal of Environmental Management (2001) 61, 25–36<br />
doi:10.1006/jema.2000.0395, available onl<strong>in</strong>e at http://www.idealibrary.com on<br />
<strong>Integrat<strong>in</strong>g</strong> <strong>water</strong>-<strong>quality</strong> <strong>management</strong><br />
and land-use <strong>plann<strong>in</strong>g</strong> <strong>in</strong> a <strong>water</strong>shed<br />
<strong>context</strong><br />
X. Wang<br />
The spatial relationships between land uses and river-<strong>water</strong> <strong>quality</strong> measured with biological, <strong>water</strong> chemistry,<br />
and habitat <strong>in</strong>dicators were analyzed <strong>in</strong> the Little Miami River <strong>water</strong>shed, OH, USA. Data obta<strong>in</strong>ed from<br />
various federal and state agencies were <strong>in</strong>tegrated with Geographic Information System spatial analysis<br />
functions. After statistically analyz<strong>in</strong>g the spatial patterns of the <strong>water</strong> <strong>quality</strong> <strong>in</strong> receiv<strong>in</strong>g rivers and land<br />
uses and other po<strong>in</strong>t pollution sources <strong>in</strong> the <strong>water</strong>shed, the results showed that the <strong>water</strong> biotic <strong>quality</strong> did<br />
not degrade significantly below waste<strong>water</strong> treatment plants. However, significantly lower <strong>water</strong> <strong>quality</strong> was<br />
found <strong>in</strong> areas downstream from high human impact areas where urban land was dom<strong>in</strong>ated or near po<strong>in</strong>t<br />
pollution sources. The study exhibits the importance of <strong>in</strong>tegrat<strong>in</strong>g <strong>water</strong>-<strong>quality</strong> <strong>management</strong> and land-use<br />
<strong>plann<strong>in</strong>g</strong>. Planners and policy-makers at different levels should br<strong>in</strong>g stakeholders together, based on the<br />
understand<strong>in</strong>g of land–<strong>water</strong> relationship <strong>in</strong> a <strong>water</strong>shed, to prevent pollution from happen<strong>in</strong>g and to plan<br />
for a susta<strong>in</strong>able future.<br />
© 2001 Academic Press<br />
Keywords: <strong>water</strong> <strong>quality</strong>, land-use <strong>plann<strong>in</strong>g</strong>, <strong>water</strong>shed <strong>management</strong>, Geographic Information<br />
Systems, Index of Biotic Integrity, Invertebrate Community Index.<br />
Introduction<br />
Industrialization and urbanization have<br />
brought prosperity, and at the same time,<br />
also have resulted <strong>in</strong> many environment<br />
problems. It has been recognized that the<br />
<strong>quality</strong> of receiv<strong>in</strong>g <strong>water</strong>s is affected by<br />
human activities <strong>in</strong> a <strong>water</strong>shed via po<strong>in</strong>t<br />
sources, such as waste<strong>water</strong> treatment<br />
facilities, and non-po<strong>in</strong>t sources, such as<br />
runoff from urban area and farm land.<br />
Although researchers have paid particular<br />
attention to the effect of land use on <strong>water</strong><br />
<strong>quality</strong> (Lenat and Crawford, 1994; Hall<br />
et al., 1994), a <strong>water</strong>-<strong>quality</strong> component often<br />
is miss<strong>in</strong>g <strong>in</strong> land-use plans and land-use<br />
<strong>plann<strong>in</strong>g</strong> is rarely used <strong>in</strong> <strong>water</strong>-<strong>quality</strong><br />
<strong>management</strong>. This could be due to the fact<br />
that <strong>water</strong>-<strong>quality</strong> <strong>management</strong> and <strong>landuse</strong><br />
<strong>plann<strong>in</strong>g</strong> often are adm<strong>in</strong>istrated by<br />
different agencies that do not coord<strong>in</strong>ate<br />
constantly. Most <strong>plann<strong>in</strong>g</strong> agencies and local<br />
Email of author: x<strong>in</strong>hao.wang@uc.edu<br />
authorities do not have resources to collect<br />
extensive land use and <strong>water</strong>-<strong>quality</strong> data <strong>in</strong><br />
develop<strong>in</strong>g plans (Wang and Y<strong>in</strong>, 1997) and<br />
<strong>water</strong>-<strong>quality</strong> <strong>management</strong> agencies traditionally<br />
address exist<strong>in</strong>g <strong>water</strong>-<strong>quality</strong> problems<br />
rather than prevent<strong>in</strong>g them.<br />
Water <strong>quality</strong> refers to the physical, biological<br />
and chemical status of the <strong>water</strong><br />
body. Streams and rivers are typically diverse<br />
and biologically productive environments <strong>in</strong><br />
their natural form. The presence, abundance,<br />
diversity and distribution of aquatic species<br />
<strong>in</strong> surface <strong>water</strong>s are dependent upon a myriad<br />
of physical and chemical factors, such<br />
as temperature, suspended solids, pH, nutrients,<br />
chemicals, and <strong>in</strong>-stream and riparian<br />
habitats. Until recently, the dom<strong>in</strong>ant methods<br />
of evaluat<strong>in</strong>g <strong>water</strong> <strong>quality</strong> are based on<br />
<strong>water</strong> chemical and, to some extent, physical<br />
properties. Studies have found that biological<br />
impacts from non-po<strong>in</strong>t sources and habitat<br />
degradation may not be fully represented by<br />
the periodical measurements of the physical–chemical<br />
characteristics of <strong>water</strong> bodies.<br />
School of Plann<strong>in</strong>g,<br />
University of C<strong>in</strong>c<strong>in</strong>nati,<br />
C<strong>in</strong>c<strong>in</strong>nati, OH<br />
45221-0016, USA<br />
Received 19 April 2000;<br />
accepted 5 October 2000<br />
0301–4797/00/010025C12 $35.00/0<br />
© 2001 Academic Press
26 X. Wang<br />
For ex<strong>amp</strong>le, the Ohio Environmental Protection<br />
Agency (OEPA) used both <strong>water</strong> chemistry<br />
and biological <strong>in</strong>dicators to evaluate<br />
<strong>water</strong> <strong>quality</strong> and discovered that the amount<br />
of impaired <strong>water</strong>s was twice the amount if<br />
chemical <strong>in</strong>dicators were used alone (OEPA,<br />
1988). To detect the effects of human activities<br />
which were missed or underestimated<br />
by the conventional physical-chemical <strong>in</strong>dicators,<br />
methods of biological assessment were<br />
developed <strong>in</strong> the 1970s and early 1980s<br />
(Norris and Norris, 1995; OEPA, 1987, 1989).<br />
Biological assessment of <strong>water</strong> <strong>quality</strong> is<br />
based on the assumption that a <strong>water</strong> body<br />
with biological <strong>in</strong>tegrity should have the<br />
ability to ‘support and ma<strong>in</strong>ta<strong>in</strong> a balanced,<br />
<strong>in</strong>tegrated, adaptive community of organisms<br />
hav<strong>in</strong>g a species composition, diversity,<br />
and functional organization comparable<br />
to that of the natural habitats with<strong>in</strong><br />
a region’ (Karr and Dudley, 1981). Therefore,<br />
those <strong>water</strong> bodies that have been<br />
impacted by human activities to various<br />
degrees should demonstrate changes <strong>in</strong> biological<br />
<strong>in</strong>tegrity. S<strong>in</strong>ce the US Environmental<br />
Protection Agency (USEPA) issued guidel<strong>in</strong>es<br />
for state environmental protection agencies<br />
to develop and implement biological<br />
assessment of surface-<strong>water</strong> <strong>quality</strong> (USEPA,<br />
1990), biological assessment has been used<br />
<strong>in</strong> various aquatic environments, such as<br />
streams, lakes and estuaries. Various organisms<br />
<strong>in</strong>clud<strong>in</strong>g fish, <strong>in</strong>sects, macro<strong>in</strong>vertebrates,<br />
and algae (especially diatoms) have<br />
been used <strong>in</strong> these studies, us<strong>in</strong>g population<br />
size, species composition or community<br />
structure, and various activities as <strong>in</strong>dicators<br />
of <strong>water</strong> <strong>quality</strong> (Angermier and Karr, 1986;<br />
Elnaggar et al., 1997). Biological assessment<br />
of <strong>water</strong> <strong>quality</strong> has proven to be a useful complementary<br />
tool to the conventional physicalchemical<br />
assessment for a wide variety of<br />
human impacts, <strong>in</strong>clud<strong>in</strong>g urban development<br />
(Khan, 1991; Norris and Norris, 1995).<br />
OEPA has been a leader <strong>in</strong> creat<strong>in</strong>g biological<br />
criteria as the operative standards for<br />
evaluat<strong>in</strong>g <strong>water</strong>-<strong>quality</strong> status by develop<strong>in</strong>g<br />
Index of Biotic Integrity (IBI) for fish<br />
communities and Invertebrate Community<br />
Index (ICI) for <strong>in</strong>vertebrates.<br />
Although the impacts of human activities<br />
on environment have been discussed<br />
and debated extensively with<strong>in</strong> conceptual<br />
and moral <strong>context</strong>s, there is much need for<br />
more empirical analyses. This paper presents<br />
a study explor<strong>in</strong>g the spatial dependence<br />
of <strong>water</strong> <strong>quality</strong> measured with <strong>water</strong><br />
chemistry, biological and habitat <strong>in</strong>dicators<br />
and land uses, us<strong>in</strong>g spatial statistical analyses<br />
based on Geographic Information Systems<br />
(GIS), <strong>in</strong> the Little Miami River (LMR)<br />
<strong>water</strong>shed, OH. After exam<strong>in</strong><strong>in</strong>g the complexity<br />
of <strong>water</strong>-<strong>quality</strong> <strong>in</strong>dicators and the<br />
relationship between the <strong>quality</strong> of receiv<strong>in</strong>g<br />
rivers and land uses <strong>in</strong> the <strong>water</strong>shed, the significance<br />
of <strong>in</strong>tegrat<strong>in</strong>g <strong>water</strong>-<strong>quality</strong> <strong>management</strong><br />
and land-use <strong>plann<strong>in</strong>g</strong> is discussed.<br />
Although the data availability limits the size<br />
of data set used <strong>in</strong> the study, the results<br />
reveal some patterns that are too significant<br />
to be ignored <strong>in</strong> <strong>water</strong>shed <strong>management</strong>.<br />
Study-area<br />
The Little Miami River <strong>water</strong>shed is located<br />
<strong>in</strong> southwest Ohio, adjacent to the greater<br />
metropolitan C<strong>in</strong>c<strong>in</strong>nati area (Figure 1). The<br />
LMR dra<strong>in</strong>s an area of 4550 square kilometers<br />
and has a ma<strong>in</strong> stem length of<br />
170 km. The northern half of the <strong>water</strong>shed<br />
is located <strong>in</strong> the Eastern Corn Belt Pla<strong>in</strong>s<br />
ecoregion (Omernik, 1988), which is characterized<br />
by level to gently slop<strong>in</strong>g land. Coarse<br />
glacial deposits (e.g. gravel, cobble, and boulders)<br />
dom<strong>in</strong>ate substrates <strong>in</strong> this region. The<br />
southern half of the <strong>water</strong>shed is located <strong>in</strong><br />
the Interior Plateau ecoregion and is characterized<br />
by higher gradient streams with<br />
bedrock (limestone and shale) substrates.<br />
Accord<strong>in</strong>g to the land-use data compiled by<br />
the Ohio Department of Natural Resources<br />
(ODNR), the LMR <strong>water</strong>shed is primarily<br />
dom<strong>in</strong>ated by cropland and pasture (71Ð0%).<br />
The second largest land use is wooded area<br />
(22Ð8%) with the urban land as the third<br />
(4Ð2%). The largest urban areas <strong>in</strong> the <strong>water</strong>shed<br />
are on the western side, which forms the<br />
eastern boundary of the grow<strong>in</strong>g metropolitan<br />
areas from Dayton to C<strong>in</strong>c<strong>in</strong>nati, OH.<br />
The LMR <strong>water</strong>shed conta<strong>in</strong>s a major recreational<br />
area and the most rapidly grow<strong>in</strong>g<br />
part of the state of Ohio. Dur<strong>in</strong>g the period<br />
from 1990–1997, population <strong>in</strong> four of the<br />
five counties which make up the majority<br />
of the LMR <strong>water</strong>shed <strong>in</strong>creased by a range<br />
of 15–25%, compared to state wide <strong>in</strong>crease<br />
of only 3Ð1%. Projected population growth <strong>in</strong><br />
this area will take the C<strong>in</strong>c<strong>in</strong>nati Standard<br />
Metropolitan Area (SMA) to over 2 000 000
Water-<strong>quality</strong> and land-use <strong>plann<strong>in</strong>g</strong> 27<br />
N<br />
Spr<strong>in</strong>gfield<br />
CLARK<br />
MADISON<br />
BUTLER<br />
HAMILTON<br />
MONTGOMERY<br />
Dayton<br />
TURTLE CR<br />
WARREN<br />
LITTLE MIAMI R<br />
GREENE<br />
CAESAR CR<br />
STONELICK CR<br />
LITTLE MIAMI R<br />
CLINTON<br />
LITTLE MIAMI R TODD FK<br />
LITTLE MIAMI R EFK<br />
FAYETTE<br />
HIGHLAND<br />
C<strong>in</strong>c<strong>in</strong>nati<br />
CLERMONT<br />
BROWN<br />
50 0 50<br />
kilometers<br />
Figure 1. Study area: Little Miami River Watershed, OH, USA. Little Miami River (...); Little Miami River<br />
Bar<strong>in</strong> (—); urban area, .<br />
by the year 2000. As a result, development<br />
pressure <strong>in</strong> the bas<strong>in</strong> is extreme.<br />
The LMR is a designated National and<br />
State Scenic River as well as an Exceptional<br />
Warm<strong>water</strong> Habitat. The river is biologically<br />
diverse <strong>in</strong> fish, mussels, macro<strong>in</strong>vertebrates,<br />
and algae. An OEPA study <strong>in</strong>dicated that<br />
although total annual load<strong>in</strong>g from po<strong>in</strong>t<br />
sources has reduced s<strong>in</strong>ce 1983 with waste<strong>water</strong><br />
treatment plant (WWTP) upgrades the<br />
cumulative total amount of pollutants still<br />
exceeds the assimilative capacity of the LMR<br />
on the upper river. Signs of stress are evident<br />
<strong>in</strong> higher rates of deformities, f<strong>in</strong> erosion,<br />
lesions, and external tumors, known as DELT<br />
anomalies <strong>in</strong> fish; and high soluble reactive<br />
phosphorus (SRP) <strong>in</strong> the river segments<br />
dom<strong>in</strong>ated by WWTP effluents (OEPA, 1995).<br />
Data<br />
This study analyzed hydrographic, land uses<br />
and <strong>water</strong>-<strong>quality</strong> data from various sources<br />
Table 1.<br />
Data and data sources<br />
Data type Data collection Data<br />
time source<br />
Water chemistry 1992–1996 USEPA<br />
Fish (IBI) 1993 OEPA<br />
Macro<strong>in</strong>vertebrate (ICI) 1993 OEPA<br />
River habitat (QHEI) 1993 OEPA<br />
IFD sites 1992 USEPA<br />
TRI sites 1987–1995 USEPA<br />
WWTP discharge po<strong>in</strong>ts 1988 USEPA<br />
1:100 000 scale 1994 USEPA<br />
river network<br />
Land use/land cover 1994 ODNR<br />
(25-m resolution)<br />
as shown <strong>in</strong> Table 1. The <strong>water</strong> chemistry<br />
data were from STORET, a uniform data collection<br />
and report<strong>in</strong>g system ma<strong>in</strong>ta<strong>in</strong>ed by<br />
USEPA, conta<strong>in</strong><strong>in</strong>g data describ<strong>in</strong>g surface<br />
and ground <strong>water</strong> <strong>quality</strong> for North American<br />
<strong>water</strong>ways (USEPA, 1992). Conventional pollutant<br />
data for the <strong>water</strong>shed were retrieved<br />
for 1992–1996 to ensure compatibility with<br />
biological and habitat data (collected <strong>in</strong> 1993).<br />
The <strong>in</strong>dicators <strong>in</strong>clude dissolved oxygen
28 X. Wang<br />
(DO), pH, total suspended solids (TSS530),<br />
nitrogen-total ammonia (NH 3 ), total organic<br />
carbon (TOC), and hardness. Those variables<br />
were selected from commonly used <strong>in</strong>dicators<br />
based on the data availability <strong>in</strong> the<br />
study area. Po<strong>in</strong>t pollution source data were<br />
retrieved from three different sources. Discharges<br />
from WWTPs, <strong>in</strong>clud<strong>in</strong>g municipal<br />
plants and small, privately owned treatment<br />
works, were retrieved from the 1988 USEPA<br />
Needs Survey (USEPA, 1989). The Industrial<br />
Facilities Discharge (IFD) sites were<br />
obta<strong>in</strong>ed from a USEPA database, updated<br />
<strong>in</strong> 1992, conta<strong>in</strong><strong>in</strong>g facility <strong>in</strong>formation on<br />
<strong>in</strong>dustrial po<strong>in</strong>t source discharges to surface<br />
<strong>water</strong>s (USEPA, 1998). Toxic Release Inventory<br />
(TRI) sites were obta<strong>in</strong>ed from a USEPA<br />
database ma<strong>in</strong>ta<strong>in</strong><strong>in</strong>g facility <strong>in</strong>formation<br />
for 1987–1995 TRI public data (USEPA,<br />
1998).<br />
Habitat, fish, and macro<strong>in</strong>vertebrate data<br />
collected dur<strong>in</strong>g an <strong>in</strong>tensive 1993 LMR<br />
survey were provided by the OEPA (Dyer<br />
et al., 1998a). IBI was first developed from<br />
12 metrics that reflected fish species richness<br />
and composition, number and abundance of<br />
<strong>in</strong>dicator species, trophic organization and<br />
function, reproductive behavior, fish abundance,<br />
and condition of <strong>in</strong>dividual fish (Simon<br />
and Lyons, 1995). Ten metrics were used to<br />
construct ICI for <strong>in</strong>vertebrates. The Qualitative<br />
Habitat Evaluation Index (QHEI),<br />
which was derived from six metrics, provided<br />
a multi-parameter physical habitat<br />
status of rivers and riparian areas (Rank<strong>in</strong>,<br />
1989).<br />
The land-use/land-cover data, obta<strong>in</strong>ed<br />
from ODNR, were extracted from the Ohio<br />
1994 statewide land-cover <strong>in</strong>ventory. The<br />
<strong>in</strong>ventory was produced from Thematic Mapper<br />
data acquired <strong>in</strong> September and October<br />
1994 at a 25-m resolution. The data were<br />
classified <strong>in</strong>to seven general land-cover categories:<br />
urban, agriculture, shrub, wooded,<br />
open <strong>water</strong>, non-forested wetlands, and barren.<br />
The digital hydrographic data were<br />
based on USEPA’s reach file version 3,<br />
RF3, a hydrological database of the surface<br />
<strong>water</strong>s of the US <strong>in</strong> ARC/INFO l<strong>in</strong>e coverage<br />
format. The database conta<strong>in</strong>s more<br />
than 3Ð2 million records encompass<strong>in</strong>g all<br />
US streams (e.g. unnamed rivers and head<strong>water</strong>s)<br />
at a scale of 1:100 000 (Dyer et al.,<br />
1998a).<br />
Spatial <strong>in</strong>tegration<br />
Biological, chemical and habitat monitor<strong>in</strong>g<br />
sites rarely occurred at the exact same<br />
locations. To relate data from these sites <strong>in</strong><br />
a spatially mean<strong>in</strong>gful way, those sites were<br />
associated to river segments spatially. The<br />
rivers were first divided <strong>in</strong>to segments <strong>in</strong> a<br />
way that WWTP discharges and confluences<br />
of major tributaries (generally greater than<br />
the first order tributaries) were used to<br />
separate two adjacent segments. Then each<br />
segment was assigned a unique identifier.<br />
The GIS spatial overlay functions were used<br />
to connect the river segments to the <strong>water</strong><br />
<strong>quality</strong> monitor<strong>in</strong>g sites based on the nearest<br />
distance. The result was that each monitor<strong>in</strong>g<br />
site had a unique river segment number.<br />
Those monitor<strong>in</strong>g sites with the same river<br />
segment number were treated as with<strong>in</strong> the<br />
same geographic unit. Detailed discussions of<br />
river segmentation and overlay analysis can<br />
be found <strong>in</strong> Dyer et al. (1998a,b).<br />
Twenty-two catchments for river segments<br />
near head<strong>water</strong>s and with <strong>water</strong> <strong>quality</strong> monitor<strong>in</strong>g<br />
data were del<strong>in</strong>eated and digitized <strong>in</strong><br />
referenc<strong>in</strong>g to the river network. Only the<br />
head<strong>water</strong> catchments were used <strong>in</strong> the <strong>landuse</strong><br />
analysis so that the catchments were<br />
spatially <strong>in</strong>dependent to each other. Those<br />
catchments were overlaid with the land use<br />
data to derive land use make-up for each<br />
catchment, us<strong>in</strong>g the ArcView Spatial Analyst<br />
Extension. The area and percentage of<br />
land uses were calculated for each catchment.<br />
Figure 2 displays the catchments and<br />
land use compositions. Mean <strong>water</strong> <strong>quality</strong><br />
data values were calculated from multiple<br />
monitor<strong>in</strong>g sites <strong>in</strong> the same catchment.<br />
Two classification schemes were used to<br />
group the <strong>water</strong> <strong>quality</strong> monitor<strong>in</strong>g sites.<br />
The first scheme separated the monitor<strong>in</strong>g<br />
sites <strong>in</strong>to two groups accord<strong>in</strong>g to their<br />
location to WWTPs. The first group <strong>in</strong>cluded<br />
those sites that were <strong>in</strong> the river segments<br />
upstream from WWTPs and the other group<br />
<strong>in</strong>cluded those sites that were <strong>in</strong> the river<br />
segments downstream from WWTPs. The<br />
second scheme separated the monitor<strong>in</strong>g<br />
sites accord<strong>in</strong>g to their proximity to po<strong>in</strong>t<br />
sources and urban land. The first group<br />
<strong>in</strong>cluded those sites that were either located<br />
<strong>in</strong> high human impact areas, <strong>in</strong>clud<strong>in</strong>g river<br />
segments <strong>in</strong> urbanized area or immediately
Water-<strong>quality</strong> and land-use <strong>plann<strong>in</strong>g</strong> 29<br />
N<br />
10 0 10<br />
kilometers<br />
Figure 2. Land-use composition <strong>in</strong> selected catchments. Land-use composition: Urban ; agriculture ;<br />
shrub scrub ; wooded . Other types of land use, not shown on the figure due to their small percentages,<br />
are: open <strong>water</strong>, non-forested wetlands and barren. Little Miami River (. . .); <strong>water</strong>shed boundary (—).
30 X. Wang<br />
downstream from a po<strong>in</strong>t pollution source,<br />
which could be a WWTP, an IFD or a TRI<br />
site. All other monitor<strong>in</strong>g sites were <strong>in</strong>cluded<br />
<strong>in</strong> the second group, which represents the low<br />
human impact areas.<br />
Statistical analysis<br />
Several statistical analyses were used to<br />
analyze the spatial distribution patterns<br />
of habitat, land uses, and <strong>water</strong> <strong>quality</strong><br />
measured with <strong>water</strong> chemistry, Fish (IBI),<br />
and Macro<strong>in</strong>vertebrate (ICI) <strong>in</strong>dicators, <strong>in</strong><br />
the study area. First, measures from the<br />
sites that were immediate upstream from<br />
WWTPs were compared with measures from<br />
sites that were immediate downstream from<br />
the same WWTPs with a paired t-test method<br />
to test the hypothesis that <strong>water</strong> <strong>quality</strong><br />
decreased below WWTP discharge po<strong>in</strong>ts.<br />
Further, an <strong>in</strong>dependent two-s<strong>amp</strong>le t-test<br />
was performed to test the hypothesis that<br />
<strong>water</strong> qualities of river segments <strong>in</strong> high<br />
human impact areas were worse than that of<br />
river segments <strong>in</strong> low human impact areas.<br />
F<strong>in</strong>ally, biological, habitat, and <strong>water</strong><br />
chemistry monitor<strong>in</strong>g values from the river<br />
segments and land use distribution with<strong>in</strong><br />
correspond<strong>in</strong>g catchment were analyzed<br />
us<strong>in</strong>g the Pearson’s correlation to reveal<br />
any possible relationships between biological<br />
<strong>in</strong>dicators and land uses and riparian habitat<br />
<strong>in</strong>dicator. Multiple regression was then used<br />
to determ<strong>in</strong>e the pr<strong>in</strong>ciple driv<strong>in</strong>g forces<br />
for biotic <strong>in</strong>tegrity with<strong>in</strong> the LMR (Dyer<br />
et al., 1998a). The purpose of the analysis<br />
is to evaluate the strength of the impact<br />
of land uses on the <strong>quality</strong> of receiv<strong>in</strong>g<br />
<strong>water</strong>s. Several <strong>water</strong>-chemistry parameters<br />
that had very small s<strong>amp</strong>le sets or were<br />
dom<strong>in</strong>ated by detection limit were dropped<br />
from the analysis.<br />
Results and discussion<br />
The results of this study are presented and<br />
discussed from three aspects—the impact<br />
of waste<strong>water</strong> treatment plants, the spatial<br />
patterns of river-<strong>water</strong> <strong>quality</strong>, and the<br />
relationship between land uses <strong>in</strong> catchments<br />
and <strong>water</strong> <strong>quality</strong> of the receiv<strong>in</strong>g <strong>water</strong>. The<br />
importance of consider<strong>in</strong>g <strong>water</strong> <strong>quality</strong> <strong>in</strong><br />
land-use <strong>plann<strong>in</strong>g</strong> is discussed based upon<br />
the f<strong>in</strong>d<strong>in</strong>gs from this study.<br />
Impact of waste<strong>water</strong> treatment<br />
plants<br />
Table 2 displays the results from a paired<br />
t-test of the IBI, ICI, and QHEI <strong>in</strong> reference<br />
to WWTP discharge po<strong>in</strong>ts. The IBI<br />
measurement from the closest sites to the<br />
discharge po<strong>in</strong>ts demonstrated a statistically<br />
significant decrease of <strong>water</strong> <strong>quality</strong> downstream<br />
from WWTP discharges. Although<br />
both ICI and QHEI demonstrated similar<br />
trend, the change was not statistically significant.<br />
This implies that the <strong>water</strong> <strong>quality</strong><br />
may not change significantly below and above<br />
WWTP discharge po<strong>in</strong>ts. The lack of strong<br />
impact may be attributed to the better municipal<br />
WWTP practices (OEPA, 1995). The<br />
result concurs with f<strong>in</strong>d<strong>in</strong>gs by others that<br />
improved <strong>management</strong> of sewage reduced the<br />
impact on receiv<strong>in</strong>g <strong>water</strong>s (Wichert, 1995;<br />
Frenzel, 1990). The result also suggests a further<br />
study to analyze the discrepancy of the<br />
sensitivities of fish <strong>in</strong>dicators (IBI) and <strong>in</strong>vertebrate<br />
<strong>in</strong>dicators (ICI) to WWTP discharges.<br />
Spatial patterns of <strong>water</strong> <strong>quality</strong><br />
A visual exam<strong>in</strong>ation of spatial distributions<br />
of the urban land use shows that there<br />
are two major urban areas with<strong>in</strong> the LMR<br />
<strong>water</strong>shed. One is near the bas<strong>in</strong> outlet<br />
at the lower left portion of the <strong>water</strong>shed<br />
and another is at upper left. In addition,<br />
there are a few smaller settlements scatter<strong>in</strong>g<br />
with<strong>in</strong> the <strong>water</strong>shed (Figure 3). It<br />
is noticed that various types of po<strong>in</strong>t pollution<br />
sources are also concentrated <strong>in</strong> or near<br />
the more urbanized areas. A t-test of the<br />
Table 2. Matched-pair t-test of <strong>water</strong> <strong>quality</strong> from<br />
upstream and downstream of WWTPs<br />
Variable Paired differences a t df Significance<br />
(1-tailed)<br />
Mean SD<br />
IBI 4Ð769 9Ð471 1Ð816 12 0Ð0472 Ł<br />
ICI 1Ð000 7Ð886 0Ð439 11 0Ð3345<br />
QHEI 1Ð875 20Ð190 0Ð256 11 0Ð3770<br />
a Paired difference is calculated as downstream monitor<strong>in</strong>g<br />
value m<strong>in</strong>us upstream monitor<strong>in</strong>g value for the same<br />
WWTP.
Water-<strong>quality</strong> and land-use <strong>plann<strong>in</strong>g</strong> 31<br />
N<br />
*<br />
*<br />
* * *<br />
* *<br />
* *<br />
*<br />
*<br />
* *<br />
*<br />
* *<br />
*<br />
*<br />
*<br />
**<br />
*<br />
* ** * *<br />
**<br />
*<br />
*<br />
*<br />
*<br />
*<br />
* *<br />
* *<br />
* * *<br />
* **<br />
* *<br />
* **<br />
**<br />
*<br />
* *<br />
* * * ** * *<br />
* *<br />
*<br />
*<br />
*<br />
*<br />
*<br />
*<br />
*<br />
*<br />
*<br />
*<br />
*<br />
*<br />
**<br />
*<br />
**<br />
*<br />
10 0 10<br />
kilometers<br />
Figure 3. Urban land and po<strong>in</strong>t pollution sources. Industrial facility discharge sites (Ł); waste<strong>water</strong>treatment<br />
plants ( ); toxic release <strong>in</strong>ventory sites ( ); Little Miami River (. . .); <strong>water</strong>shed boundary ( ).<br />
mean monitor<strong>in</strong>g values from the sites <strong>in</strong> the<br />
high and low human impact areas was performed<br />
upon the three <strong>in</strong>dicators (Table 3).<br />
Both IBI and ICI values demonstrated significantly<br />
lower values <strong>in</strong> high human impact<br />
areas. It was <strong>in</strong>terest<strong>in</strong>g to note that habitats<br />
also showed lower <strong>quality</strong> <strong>in</strong> those areas, as<br />
<strong>in</strong>dicated by low QHEI scores. These results<br />
imply that the biological <strong>in</strong>tegrity <strong>in</strong> rivers<br />
flow<strong>in</strong>g through high human impact areas<br />
tend to be lower.<br />
Land uses and <strong>water</strong> <strong>quality</strong> of the<br />
receiv<strong>in</strong>g <strong>water</strong>s<br />
Among the 22 catchments, urban land<br />
percentages varied from 1% to 58% and
32 X. Wang<br />
Table 3. Independent t-test on the <strong>water</strong> monitor<strong>in</strong>g<br />
data <strong>in</strong> LMR <strong>water</strong>shed<br />
Para- High human Low human t p a<br />
meter impact area impact area<br />
Mean N Mean N<br />
IBI 33Ð27 77 44Ð50 68 8Ð625 5Ð55E-15 b<br />
ICI 34Ð94 36 43Ð77 35 3Ð288 0Ð0008 b<br />
QHEI 62Ð45 73 73Ð77 61 5Ð869 1Ð67E-08 b<br />
a Significance level or the less-than and equal-to probability<br />
of the t value.<br />
b Significant at the 0Ð05 level.<br />
agricultural-land percentages varied between<br />
12% and 95% (Figure 2). The IBI and ICI<br />
have similar relationships to habitat <strong>quality</strong><br />
(QHEI) and land uses although the levels<br />
of significance vary (Table 4). These biological<br />
<strong>in</strong>dicators are negatively related to<br />
the percentages of urban land use and positively<br />
related to agricultural land use. They<br />
also are positively related to habitat <strong>quality</strong>.<br />
The correlation analysis showed that at<br />
0Ð05 significant level the IBI scores were<br />
significantly correlated with percentage of<br />
urban land use ( 0Ð59) and agricultural<br />
land use (0Ð53). IBI was also positively correlated<br />
with QHEI (0Ð67). The correlations<br />
between ICI and QHEI and land uses were<br />
not statistically significant. The results suggest<br />
that IBI may be a more sensitive to<br />
land-use composition and riparian-habitat<br />
<strong>quality</strong>.<br />
Table 4. Pearson product movement correlation<br />
coefficients<br />
Land use and habitat IBI ICI<br />
Urban<br />
Pearson correlation 0Ð59 a 0Ð22<br />
Significance (2-tailed) 0Ð00 0Ð40<br />
S<strong>amp</strong>le size 22 16<br />
Agriculture<br />
Pearson correlation 0Ð53 a 0Ð30<br />
Significance (2-tailed) 0Ð01 0Ð26<br />
S<strong>amp</strong>le size 22 16<br />
Wooded<br />
Pearson correlation 0Ð27 a 0Ð28<br />
Significance (2-tailed) 0Ð23 0Ð30<br />
S<strong>amp</strong>le size 22 16<br />
QHEI<br />
Pearson correlation 0Ð67 a 0Ð41<br />
Significance (2-tailed) 0Ð00 0Ð11<br />
S<strong>amp</strong>le size 22 16<br />
a Correlation is significant at the 0Ð05 level (2-tailed).<br />
In a previous study Dyer et al. (1998a)<br />
applied a multivariate forward stepwise<br />
regression model to determ<strong>in</strong>e the relative<br />
importance of <strong>water</strong> chemistry and habitat<br />
on biological <strong>in</strong>dicators <strong>in</strong> the Little Miami<br />
River <strong>water</strong>shed. Their study concluded that<br />
the habitat <strong>quality</strong> was primarily responsible<br />
for the biological <strong>in</strong>tegrity of receiv<strong>in</strong>g <strong>water</strong>s<br />
<strong>in</strong> the <strong>water</strong>shed. A similar regression analysis<br />
was conducted <strong>in</strong> this study on the 22<br />
selected catchments. Percentages of urban<br />
and wooded land uses by catchment were<br />
<strong>in</strong>cluded <strong>in</strong> the multiple regression analysis,<br />
<strong>in</strong> addition to the habitat and <strong>water</strong> chemistry<br />
<strong>in</strong>dicators used <strong>in</strong> Dyer et al. (1998a).<br />
The percentage of agricultural land was not<br />
<strong>in</strong>cluded because it was highly correlated<br />
with the percentage of urban land. Other<br />
<strong>in</strong>dependent variables were the six <strong>water</strong><br />
chemistry variables—dissolved oxygen, pH,<br />
total suspended solids, nitrogen-total ammonia,<br />
total organic carbon, and hardness, and<br />
QHEI. The dependent variables were IBI and<br />
ICI, respectively. Figure 4 shows the scatter<br />
plots of the predicted values aga<strong>in</strong>st measured<br />
values for IBI and ICI, respectively.<br />
The results shown <strong>in</strong> Table 5 <strong>in</strong>dicate that<br />
the land-use components with<strong>in</strong> the catchments<br />
could be major predictors for biotic<br />
<strong>in</strong>tegrity. The percentage of urban land was<br />
the second strongest predictor for both IBI<br />
and ICI. The negative signs of those coefficients<br />
<strong>in</strong>dicate that as the <strong>in</strong>tensity of human<br />
activities <strong>in</strong>crease there is a tendency that the<br />
biological <strong>in</strong>tegrity of the rivers decreases.<br />
The percentage of wooded land was the third<br />
strongest predictor for IBI. The positive sign<br />
of the coefficient shows that higher river biological<br />
<strong>quality</strong> may be expected <strong>in</strong> areas of<br />
less <strong>in</strong>tensity of human impact. When the<br />
results for the two dependent variables, it<br />
appears that the <strong>in</strong>dependent variables can<br />
expla<strong>in</strong> IBI better than ICI.<br />
Water <strong>quality</strong> consideration <strong>in</strong><br />
land-use <strong>plann<strong>in</strong>g</strong><br />
This study exhibits the complexity of <strong>water</strong><br />
<strong>quality</strong> <strong>in</strong>dicators and their spatial distribution.<br />
Such complexity implies that different<br />
<strong>in</strong>dicators often reflect different aspects of a<br />
<strong>water</strong> body and the status of <strong>water</strong> <strong>quality</strong><br />
may be affected by many factors <strong>in</strong> different<br />
ways. Although <strong>water</strong> chemistry <strong>in</strong> the Little
Water-<strong>quality</strong> and land-use <strong>plann<strong>in</strong>g</strong> 33<br />
Regression adjusted (press) predicted value<br />
Regression adjusted (press) predicted value<br />
60<br />
50<br />
40<br />
30<br />
20<br />
10<br />
50<br />
40<br />
30<br />
20<br />
10<br />
0<br />
(a)<br />
(b)<br />
10<br />
20<br />
30 40<br />
Measured value<br />
20 30 40<br />
Measured value<br />
Figure 4. Comparison of predicted and measured<br />
biological <strong>in</strong>dicator values. (a) Dependent variable:<br />
IBI; (b) dependent variable: ICI.<br />
Miami River was at good condition (several<br />
of the <strong>water</strong> chemistry variables were at<br />
or below detection limit, which might have<br />
contributed to the fewer data available for<br />
the analysis), biotic <strong>in</strong>dicators have picked<br />
up some effects of human activities on the<br />
receiv<strong>in</strong>g <strong>water</strong>. The t-test showed that urban<br />
land and po<strong>in</strong>t sources (WWTPs, IFDs, and<br />
TRIs) together might expla<strong>in</strong> the lower biotic<br />
<strong>quality</strong> throughout the <strong>water</strong>shed. This f<strong>in</strong>d<strong>in</strong>g<br />
confirms that one of the greatest causes<br />
50<br />
50<br />
60<br />
60<br />
of <strong>water</strong>-<strong>quality</strong> problem derives from urban<br />
land use as a result of the <strong>in</strong>creas<strong>in</strong>g <strong>in</strong>tensity<br />
of human activities. Pollution has resulted <strong>in</strong><br />
loss of species diversity with<strong>in</strong> rivers (Haycock<br />
and Muscutt, 1995).<br />
The hydrological relationship between<br />
<strong>water</strong> systems and the land requires<br />
coord<strong>in</strong>ation between the <strong>water</strong> <strong>management</strong><br />
and land <strong>management</strong> fields. Once the<br />
land–<strong>water</strong> relationship is identified, it<br />
leads to the need of protect<strong>in</strong>g <strong>water</strong><br />
<strong>quality</strong> through proper land-use <strong>plann<strong>in</strong>g</strong> by<br />
identify<strong>in</strong>g cost-effective pollution prevention<br />
and pollution correction approaches that<br />
can address all the sources of pollution<br />
<strong>in</strong> a comprehensive way. To take such<br />
challenge, it is necessary to look <strong>in</strong>to<br />
<strong>water</strong>-<strong>quality</strong> <strong>management</strong> and land-use<strong>plann<strong>in</strong>g</strong><br />
practices and draw the connection<br />
between the two. By tradition, <strong>water</strong><strong>quality</strong><br />
<strong>management</strong> and land-use <strong>plann<strong>in</strong>g</strong><br />
are implemented by different agencies<br />
with different objectives. The purpose of<br />
<strong>water</strong>-<strong>quality</strong> <strong>management</strong> is to ma<strong>in</strong>ta<strong>in</strong><br />
and improve ambient <strong>water</strong> <strong>quality</strong>,<br />
which requires designation of <strong>water</strong><br />
usage, establishment of criteria to protect<br />
designated uses, and development of <strong>water</strong><strong>quality</strong><br />
<strong>management</strong> plans accord<strong>in</strong>gly.<br />
The objective of land-use <strong>plann<strong>in</strong>g</strong> is to<br />
maximize the uses of land by humans<br />
while m<strong>in</strong>imiz<strong>in</strong>g the negative impact to<br />
humans’ health and welfare. Land-use<br />
<strong>plann<strong>in</strong>g</strong>, after systematically analyz<strong>in</strong>g<br />
different alternatives and the need for<br />
land use changes, determ<strong>in</strong>es future land<br />
uses, improves physical conditions for the<br />
planned land uses, and manages activities<br />
associated with the planned land uses (van<br />
Lier, 1998). In practice, land-use <strong>plann<strong>in</strong>g</strong><br />
is often fragmented temporally and spatially<br />
s<strong>in</strong>ce most land-use plan is often produced<br />
for area with<strong>in</strong> a political boundary and<br />
Table 5.<br />
Results of forward stepwise multiple regression analysis<br />
Dependent variable IBI ICI<br />
Adjusted R 2 0Ð934 0Ð773<br />
Coefficient<br />
Constant 16Ð823 2Ð345<br />
Predictor 1 QHEI 0Ð761 Hardness 0Ð058<br />
Predictor 2 % of Urban land 45Ð078 % of Urban land 81Ð472<br />
Predictor 3 % of Wooded land 35Ð194 Dissolved oxygen 3Ð793<br />
Use probability of F less than or equal to 0Ð1 for <strong>in</strong>clusion of the <strong>in</strong>dependent variables (predictors)<br />
and the coefficients are different from zero at 0Ð5 significance level.
34 X. Wang<br />
only to serve the community which adopt<br />
the plan. In the United States, land-use<br />
<strong>plann<strong>in</strong>g</strong> is implemented at local community<br />
level (municipal or county) (Thomas and<br />
Furuseth, 1997) and consequently non-local<br />
<strong>in</strong>terests are not considered equally <strong>in</strong> <strong>landuse</strong><br />
<strong>plann<strong>in</strong>g</strong> decision-mak<strong>in</strong>g. For ex<strong>amp</strong>le,<br />
typical land-use suitability and feasibility<br />
analyses often are limited to the proposed<br />
property and immediately surrounded areas.<br />
Water-<strong>quality</strong> issue is usually not sufficiently<br />
studied <strong>in</strong> land-use <strong>plann<strong>in</strong>g</strong>.<br />
The impact of urban land uses on river<br />
<strong>water</strong> <strong>quality</strong> demonstrated <strong>in</strong> this study<br />
suggests that the known land–<strong>water</strong> relationship<br />
is significant enough for planners<br />
and decision-makers to pay proper attention<br />
to <strong>water</strong>-<strong>quality</strong> issues <strong>in</strong> evaluat<strong>in</strong>g<br />
plans and facilitat<strong>in</strong>g collaborations. Achiev<strong>in</strong>g<br />
the susta<strong>in</strong>able <strong>management</strong> of <strong>water</strong><br />
and land resources could be a major consideration<br />
<strong>in</strong> explor<strong>in</strong>g <strong>plann<strong>in</strong>g</strong> alternatives<br />
with<strong>in</strong> a <strong>water</strong>shed. After realiz<strong>in</strong>g the<br />
<strong>water</strong>-<strong>quality</strong> problems related to non-po<strong>in</strong>t<br />
sources and the loss of aquatic habitat, the<br />
US EPA has been promot<strong>in</strong>g an ecologicalbased<br />
<strong>water</strong>shed protection approach (WPA)<br />
(Brady, 1996). The WPA del<strong>in</strong>eates a geographic<br />
area based on its natural characteristics—a<br />
<strong>water</strong>shed—and the stakeholders<br />
whose activities are on <strong>water</strong> or land with<strong>in</strong><br />
the <strong>water</strong>shed are <strong>in</strong>volved <strong>in</strong> def<strong>in</strong><strong>in</strong>g problems,<br />
set priorities, and implement solutions<br />
(Davenport et al., 1996). The LMR study<br />
shows that the WWTPs alone may not significantly<br />
affect the <strong>water</strong> <strong>quality</strong> while the<br />
comb<strong>in</strong>ed affect from po<strong>in</strong>t sources (WWTPs,<br />
TRIs, IFDs) and non-po<strong>in</strong>t sources (urban<br />
land) can be reflected <strong>in</strong> the <strong>water</strong>-<strong>quality</strong><br />
data. At present, only po<strong>in</strong>t sources are regulated<br />
by environmental agencies such as<br />
OEPA <strong>in</strong> LMR <strong>water</strong>shed while non-po<strong>in</strong>t<br />
sources are unregulated. This study result<br />
shows that such <strong>management</strong> may not be<br />
effective <strong>in</strong> <strong>water</strong> <strong>quality</strong> protection. The<br />
f<strong>in</strong>d<strong>in</strong>g re<strong>in</strong>forces the notion that <strong>management</strong><br />
of po<strong>in</strong>t and non-po<strong>in</strong>t sources should<br />
be coord<strong>in</strong>ated. Such effort <strong>in</strong>volves all levels<br />
of government, other agencies and stakeholders<br />
<strong>in</strong> a structured and focused process<br />
s<strong>in</strong>ce a susta<strong>in</strong>able community is <strong>in</strong>terconnected<br />
with surround<strong>in</strong>g communities and<br />
the susta<strong>in</strong>ability of a larger region is supported<br />
by the collaboration of these communities<br />
(Thomas and Furuseth, 1997). Proper<br />
land-use <strong>plann<strong>in</strong>g</strong> with<strong>in</strong> a <strong>water</strong>shed can<br />
protect <strong>water</strong> <strong>quality</strong> and reach economic<br />
goals. Although <strong>water</strong>sheds are <strong>in</strong>creas<strong>in</strong>gly<br />
viewed as appropriate natural spatial unit for<br />
<strong>plann<strong>in</strong>g</strong> and for susta<strong>in</strong>able <strong>water</strong> resources<br />
<strong>management</strong>, <strong>water</strong>sheds have not received<br />
as much attention <strong>in</strong> land-use <strong>plann<strong>in</strong>g</strong> field<br />
as that <strong>in</strong> the biological and environmental<br />
studies. This may be attributed to the nature<br />
of traditional <strong>plann<strong>in</strong>g</strong> practice. Watersheds<br />
are often divided <strong>in</strong>to areas that are under<br />
different <strong>plann<strong>in</strong>g</strong> and political jurisdictions<br />
and the coord<strong>in</strong>ation among them is often<br />
m<strong>in</strong>imal. With more studies demonstrat<strong>in</strong>g<br />
that the effects of human activities can and<br />
do cross political boundaries the development<br />
and implementation of <strong>water</strong>-<strong>quality</strong>-based<br />
<strong>water</strong>shed land-use plans should be viewed<br />
as an <strong>in</strong>tegrated and holistic approach.<br />
The LMR study demonstrates several evidences<br />
that call for <strong>in</strong>tegration of <strong>water</strong><strong>quality</strong><br />
<strong>management</strong> and land-use <strong>plann<strong>in</strong>g</strong><br />
to aim at <strong>water</strong> uses <strong>in</strong> a manner that will<br />
maximize the socio-economic benefits to the<br />
society without jeopardiz<strong>in</strong>g the balance of<br />
the resource-related ecosystems. Although<br />
<strong>water</strong> chemistry <strong>in</strong> the LMR <strong>water</strong>shed was<br />
at good condition, biotic <strong>in</strong>dicators have<br />
picked up the effect of human activities on<br />
the <strong>water</strong> <strong>quality</strong>. Such effect is a comb<strong>in</strong>ation<br />
of po<strong>in</strong>t and non-po<strong>in</strong>t sources, which are<br />
connected with land uses <strong>in</strong> the <strong>water</strong>shed,<br />
and the riparian habitat <strong>quality</strong>. The relationship<br />
between <strong>water</strong> <strong>quality</strong> of receiv<strong>in</strong>g<br />
rivers and land uses <strong>in</strong> a <strong>water</strong>shed <strong>in</strong>dicates<br />
that <strong>in</strong>creas<strong>in</strong>g population pressure <strong>in</strong><br />
a <strong>water</strong>shed is result<strong>in</strong>g <strong>in</strong> <strong>in</strong>creas<strong>in</strong>g loads<br />
of nutrients and other pollutants which may<br />
cause severe degradation of <strong>water</strong> <strong>quality</strong><br />
and consequent use impairments of the <strong>water</strong><br />
bodies. The <strong>in</strong>tegration of <strong>water</strong>-<strong>quality</strong> <strong>management</strong><br />
and land-use <strong>plann<strong>in</strong>g</strong> can promote<br />
protect<strong>in</strong>g the biotic <strong>quality</strong> and habitat<br />
health and prevent<strong>in</strong>g pollution from happen<strong>in</strong>g,<br />
which serves the purpose of protect<strong>in</strong>g<br />
<strong>water</strong> <strong>quality</strong> and ma<strong>in</strong>ta<strong>in</strong><strong>in</strong>g ecologically<br />
and economically healthy land development.<br />
The study also demonstrates that the river<br />
biological <strong>in</strong>tegrity is strongly related to<br />
the habitat health (Tables 4 and 5). This<br />
l<strong>in</strong>kage suggests that the goal of protect<strong>in</strong>g<br />
<strong>water</strong> <strong>quality</strong> through land-use <strong>plann<strong>in</strong>g</strong><br />
can and should be achieved through habitat<br />
protection. Ma<strong>in</strong>ta<strong>in</strong><strong>in</strong>g a healthy habitat can<br />
help to improve <strong>water</strong> <strong>quality</strong> and promote
Water-<strong>quality</strong> and land-use <strong>plann<strong>in</strong>g</strong> 35<br />
biodiversity and preserve landscape features<br />
and the aesthetic appeal of the <strong>water</strong>shed.<br />
A good ex<strong>amp</strong>le of such <strong>in</strong>tegration is to<br />
develop riverside corridors that can have<br />
many benefits such as protect<strong>in</strong>g <strong>water</strong><br />
<strong>quality</strong>, enhanc<strong>in</strong>g biological diversity and<br />
m<strong>in</strong>imiz<strong>in</strong>g soil erosion.<br />
As <strong>water</strong> <strong>quality</strong> and land-use data become<br />
more accessible, planners and policy-makers<br />
at different levels should br<strong>in</strong>g stakeholders<br />
together to substantially <strong>in</strong>crease the health<br />
of the environment by identify<strong>in</strong>g sources of<br />
the problems, understand<strong>in</strong>g the relationship<br />
between the sources and consequences, and<br />
search<strong>in</strong>g for solutions to these problems.<br />
This study shows that such effort can be at a<br />
local level, such as protect and improve riparian<br />
habitat through a variety of <strong>plann<strong>in</strong>g</strong><br />
practices such as vegetation buffers along<br />
rivers and better <strong>management</strong> of discharges<br />
<strong>in</strong>to the river. The protection of river also<br />
extends to land uses <strong>in</strong> the entire <strong>water</strong>shed,<br />
which requires a more regional collaboration.<br />
Acknowledgements<br />
The author thanks Scott Dyer and Charlotte White<br />
who provided data and <strong>in</strong>itiated the study, and the<br />
anonymous reviewers who contributed through<br />
discussions and comments for this manuscript.<br />
References<br />
Angermier, P. L. and Karr, J. R. (1986). Apply<strong>in</strong>g<br />
an <strong>in</strong>dex of biotic <strong>in</strong>tegrity based on streamfish<br />
communities: considerations <strong>in</strong> s<strong>amp</strong>l<strong>in</strong>g<br />
and <strong>in</strong>terpretation. North American Journal of<br />
Fisheries Management 6, 418–429.<br />
Brady, D. J. (1996). The <strong>water</strong>shed protection<br />
approach. Water Science and Technology 33,<br />
17–21.<br />
Davenport, T. E., Phillips, N. J., Kirschner, B. A.<br />
and Kirschner, L. T. (1996). The <strong>water</strong>shed<br />
protection approach: a framework for ecosystem<br />
protection. Water Science and Technology 33,<br />
23–26.<br />
Dyer, S. D., White-Hull, C. E., Wang, X., Johnson,<br />
T. D. and Carr, G. J. (1998a). Determ<strong>in</strong><strong>in</strong>g<br />
the <strong>in</strong>fluence of habitat and chemical factors on<br />
<strong>in</strong>stream biotic <strong>in</strong>tegrity for a Southern Ohio<br />
<strong>water</strong>shed. Journal of Aquatic Ecosystem Stress<br />
and Recovery 6, 91–110.<br />
Dyer, S. D., White-Hull, C. E., Johnson, T. D.,<br />
Carr, G. J. and Wang, X. (1998b). The importance<br />
of space <strong>in</strong> understand<strong>in</strong>g the risk of<br />
multiple streesors on the biological <strong>in</strong>tegrity<br />
of receiv<strong>in</strong>g <strong>water</strong>s. Journal of Hazardous<br />
Materials 61, 37–41.<br />
Elnaggar, M. E., Shaabandessouki, S. A., Abdelhamid,<br />
M. I. and Elham, M. A. (1997). Effect<br />
of treated sewage on the <strong>water</strong>-<strong>quality</strong> and<br />
phytoplankton population of Lake Manzala<br />
(Egypt) with emphasis on biological assessment<br />
of <strong>water</strong> <strong>quality</strong>. Microbiologica 20, 253–276.<br />
Frenzel, S. A. (1990). Effects of municipal waste<strong>water</strong><br />
discharges on aquatic communities, Boise<br />
River, Idaho. Water Resources Bullet<strong>in</strong> 26,<br />
279–287.<br />
Hall, L. W., Fischer, S. A., Killen, W. D., Jr,<br />
Scott, M. C., Ziegenfuss, M. C. and<br />
Anderson, R. D. (1994). Status assessment <strong>in</strong><br />
acid-sensitive and non-acid-sensitive Maryland<br />
coastal pla<strong>in</strong> streams us<strong>in</strong>g an <strong>in</strong>tegrated<br />
biological, chemical, physical, and land-use<br />
approach. Journal of Aquatic Ecosystem Health<br />
3, 145–167.<br />
Haycock, N. E. and Muscutt, A. D. (1995). Landscape<br />
<strong>management</strong> strategies for the control of<br />
diffuse pollution. Landscape And Urban Plann<strong>in</strong>g<br />
31, 313–321.<br />
Karr, J. R. and Dudley, D. R. (1981). Ecological perspectives<br />
on <strong>water</strong> <strong>quality</strong> goals. Environmental<br />
Management 5, 55–68.<br />
Khan, I. S. (1991). Effect of urban and <strong>in</strong>dustrialwastes<br />
on species-diversity of the diatom community<br />
<strong>in</strong> a tropical river, Malaysia. Hydrobiologia<br />
224, 175–184.<br />
Lenat, D. R. and Crawford, J. K. (1994). Effects of<br />
land use on <strong>water</strong> <strong>quality</strong> and aquatic biota<br />
of three North Carol<strong>in</strong>a Piedmont streams.<br />
Hydrobiologia 294, 185–199.<br />
Norris, R. H. and Norris, K. R. (1995). The<br />
need for biological assessment of <strong>water</strong>-<strong>quality</strong>,<br />
Australian perspective. Australian Journal of<br />
Ecology 20, 1–6.<br />
OEPA (1987). Users Manual for Biological Field<br />
Assessment of Ohio Rivers and Streams. Division<br />
of Water Quality Monitor<strong>in</strong>g and Assessment.<br />
Columbus, OH: Ohio Environmental Protection<br />
Agency.<br />
OEPA (1988). The Role of Biological Data <strong>in</strong> Water<br />
Quality Assessment. Vol 1. Biological Criteria<br />
for the Protection of Aquatic Life. Columbus,<br />
OH: State of Ohio Environmental Protection<br />
Agency.<br />
OEPA (1989). Biological Criteria for the Protection<br />
of Aquatic Life: Volume III: Standardized<br />
Biological Field S<strong>amp</strong>l<strong>in</strong>g and Laboratory Methods<br />
for Assess<strong>in</strong>g Fish and Macro<strong>in</strong>vertebrate<br />
Communities. Columbus, OH: State of Ohio<br />
Environmental Protection Agency.<br />
OEPA (1995). Biological and Water Quality Study<br />
of the Little Miami River and Selected Tributaries.<br />
Vol 1 and 11. Monitor<strong>in</strong>g and Assessment<br />
Section. Columbus, OH: Ohio Environmental<br />
Protection Agency Technical Report.<br />
MAS/199412-11.<br />
Omernik, J. M. (1988). Ecoregions of the coterm<strong>in</strong>ous<br />
United States. Annual Association of<br />
American Geographer 77, 118–125.<br />
Rank<strong>in</strong>, E. T. (1989). The Qualitative Habitat<br />
Evaluation Index (QHEI): Rationale, Methods<br />
and Application. Columbus, OH: Ohio Environmental<br />
Protection Agency.
36 X. Wang<br />
Simon, T. P. and Lyons, J. (1995). Application of<br />
the <strong>in</strong>dex of biotic <strong>in</strong>tegrity to evaluate <strong>water</strong><br />
resource <strong>in</strong>tegrity <strong>in</strong> fresh<strong>water</strong> ecosystems. In<br />
Biological Assessment and Criteria: Tools for<br />
Water Resource Plann<strong>in</strong>g and Decision Mak<strong>in</strong>g<br />
(W. S. Davis and T. P. Simon, eds), pp. 217–244.<br />
Boca Raton, FL: Lewis Publishers.<br />
Thomas, D. S. K. and Furuseth, O. J. (1997). The<br />
realities of <strong>in</strong>corporat<strong>in</strong>g susta<strong>in</strong>able development<br />
<strong>in</strong>to local-level <strong>plann<strong>in</strong>g</strong>: a case study of<br />
Dividson, North Carol<strong>in</strong>a. Cities 14, 219–226.<br />
USEPA (1989). 1988 Needs Survey: Report<br />
to Congress—Assessment of Needed Publiclyowned<br />
Treatment Facilities <strong>in</strong> the United States.<br />
Wash<strong>in</strong>gton, DC: US Environmental Protection<br />
Agency. EPA E30/9-89-001.<br />
USEPA (1990). Biological Criteria: National Program<br />
Guidance for Surface Waters. Wash<strong>in</strong>gton<br />
DC: US Environmental Protection Agency. EPA-<br />
440/5-90-004.<br />
USEPA (1992). STORET Documentation for Menu-<br />
Driven User Interface. San Francisco, CA: US<br />
Environmental Protection Agency. Region IX.<br />
EPA 68-C9-0013.<br />
USEPA (1998). Better Assessment Science <strong>Integrat<strong>in</strong>g</strong><br />
Po<strong>in</strong>t and Non-po<strong>in</strong>t Sources (BASINS).<br />
Version 2. Wash<strong>in</strong>gton, DC: US Environmental<br />
Protection Agency. EPA-823-B-98-006.<br />
van Lier, H. N. (1998). The role of land-use <strong>plann<strong>in</strong>g</strong><br />
<strong>in</strong> susta<strong>in</strong>able rural systems. Landscape<br />
And Urban Plann<strong>in</strong>g 41, 83–91.<br />
Wang, X. and Y<strong>in</strong>, Z.-Y. (1997). Us<strong>in</strong>g GIS to<br />
assess the relationship between land use on<br />
<strong>water</strong> <strong>quality</strong> at a <strong>water</strong>shed level. Environment<br />
International 23, 103–114.<br />
Wichert, G. A. (1995). Effects of improved sewage<br />
effluent <strong>management</strong> and urbanization on fish<br />
associations of Toronto streams. North American<br />
Journal of Fisheries Management 15,<br />
440–456.