

Productivity of wheat/faba bean intercropping systems in response to sulphur fertilization and seed rate under contrasting management conditions
Abstract Two field experiments carried out in contrasting production system (conventional versus organic) investigated the effects of sulphur (S) fertilization and wheat seed rate in wheat/faba bean (bean) intercropping system. For the conventional experiment, S fertilization reduced wheat seed yields and biomass yields substantially. Maximum wheat seed yields were 278 g/m2 and 391 g/m2 for S applied and S withheld respectively. On the other hand, at 200 wheat seeds/m2 application of S significantly increased bean intercrop seed yield. Bean seed yields were 195.8 g/m2 and 81.9 g/m2 for S and without S respectively. For the seed yield, based on crop performance ratio (CPR), wheat in the intercrop was more efficient than the sole crop only at 200 wheat seeds/m2 when S was withheld as indicated by CPR value of 1.11. The maximum CPR for the bean of 1.87 was obtained at 200 wheat seeds/m2 when S was applied. For both wheat and bean, application of S had no substantial effects on harvest index. Whilst application of S had a positive effects on accumulated photosynthetically active radiation by the intercrop, radiation use efficiency was conservative in response to S fertilization. For the conventional experiment, it was concluded that bean competed with the wheat intensely for S than for N leading to higher yields for the bean when S was applied than when S was withheld. Hence, wheat intercrop seed yields were substantially reduced when S was applied. By contrast, in the organic experiment, S fertilization had no significant effects on the above-mentioned variables.
Abstract
Two field experiments carried out in contrasting production system (conventional versus organic) investigated the effects of sulphur (S) fertilization and wheat seed rate in wheat/faba bean (bean) intercropping system. For the conventional experiment, S fertilization reduced wheat seed yields and biomass yields substantially. Maximum wheat seed yields were 278 g/m2 and 391 g/m2 for S applied and S withheld respectively. On the other hand, at 200 wheat seeds/m2 application of S significantly increased bean intercrop seed yield. Bean seed yields were 195.8 g/m2 and 81.9 g/m2 for S and without S respectively. For the seed yield, based on crop performance ratio (CPR), wheat in the intercrop was more efficient than the sole crop only at 200 wheat seeds/m2 when S was withheld as indicated by CPR value of 1.11. The maximum CPR for the bean of 1.87 was obtained at 200 wheat seeds/m2 when S was applied. For both wheat and bean, application of S had no substantial effects on harvest index. Whilst application of S had a positive effects on accumulated photosynthetically active radiation by the intercrop, radiation use efficiency was conservative in response to S fertilization. For the conventional experiment, it was concluded that bean competed with the wheat intensely for S than for N leading to higher yields for the bean when S was applied than when S was withheld. Hence, wheat intercrop seed yields were substantially reduced when S was applied. By contrast, in the organic experiment, S fertilization had no significant effects on the above-mentioned variables.

You also want an ePaper? Increase the reach of your titles
YUMPU automatically turns print PDFs into web optimized ePapers that Google loves.
Int. J. Agr. & Agri. R.<br />
Effect <strong>of</strong> <strong>sulphur</strong> <strong>fertilization</strong> <strong>and</strong> its <strong>in</strong>teractions<br />
with <strong>wheat</strong> <strong>seed</strong> <strong>rate</strong> <strong>and</strong>/or <strong>bean</strong> treatment on<br />
determ<strong>in</strong>ants <strong>of</strong> <strong>seed</strong> yields<br />
In Experiment 1 (conventional experiment), similar<br />
<strong>to</strong> the effects on <strong>seed</strong> yields, S treatment reduced<br />
<strong>wheat</strong> biomass yields <strong>and</strong> the effect was greater for<br />
the <strong>in</strong>tercrop than the sole crop. The mean effect <strong>of</strong><br />
S treatment on <strong>wheat</strong> biomass yield was significant<br />
(P = 0.022). For the mean effects <strong>of</strong> S application,<br />
<strong>wheat</strong> biomass yields were 340 g/m 2 <strong>and</strong> 435 g/m 2<br />
for S <strong>and</strong> without S respectively (SED 14. 5; DF 2).<br />
This <strong>in</strong>dicates that S application significantly<br />
reduced <strong>wheat</strong> biomass yield. The effect <strong>of</strong> wsr on<br />
biomass yield deviated from l<strong>in</strong>earity (P < 0.001 for<br />
the quadratic wsr effects). There was significant<br />
<strong>in</strong>teractive effect between S <strong>and</strong> wsr (P = 0.001 for S<br />
x l<strong>in</strong>ear wsr effects). When S was applied, <strong>wheat</strong><br />
biomass yields were 130 g/m 2 , 306 g/m 2 , 429 g/m 2<br />
<strong>and</strong> 495 g/m 2 for 10, 50, 100 <strong>and</strong> 200 <strong>wheat</strong><br />
<strong>seed</strong>s/m 2 respectively (SED 25.8; DF 7.82).<br />
Similarly, when S was withheld <strong>wheat</strong> biomass<br />
yields were 125 g/m 2 , 381 g/m 2 , 544 g/m 2 <strong>and</strong> 691<br />
g/m 2 for 10, 50, 100 <strong>and</strong> 200 <strong>wheat</strong> <strong>seed</strong>s/m 2<br />
respectively. The mean effect <strong>of</strong> <strong>bean</strong> treatment was<br />
also significant (P < 0.01), but S did not <strong>in</strong>teract<br />
significantly with <strong>bean</strong> (P > 0.05). There was<br />
significant <strong>in</strong>teraction between wsr <strong>and</strong> <strong>bean</strong> (P =<br />
0.038 for quadratic wsr x <strong>bean</strong> effects). However,<br />
there was no significant <strong>in</strong>teraction detected<br />
between wsr, S <strong>and</strong> <strong>bean</strong> treatment (P > 0.05; SED<br />
79. 3; DF 9.86). Nevertheless, despite <strong>in</strong>significant<br />
ANOVA outputs, similar <strong>to</strong> the <strong>seed</strong> yields,<br />
Equation 1 quantified <strong>wheat</strong> sole crop with S<br />
applied <strong>and</strong> <strong>wheat</strong> sole crop without S applied<br />
biomass yield <strong>response</strong>s (Fig. 2). The parameter<br />
values are presented <strong>in</strong> Table 4. On the other h<strong>and</strong>,<br />
<strong>wheat</strong> <strong>in</strong>tercrop with S applied biomass yield<br />
<strong>response</strong> was quantified simply as Y = 51 + 1.34 wsr<br />
– 0.0048 wsr 2 (Fig. 2), r 2 = 0.94, whilst without S as<br />
Y = 56 + 2.31 wsr (Fig. 2), r 2 = 0.98. Hence, <strong>wheat</strong><br />
biomass yields followed similar pattern as the <strong>seed</strong><br />
yield.<br />
Biomass yields (g/m 2 )<br />
1000<br />
800<br />
600<br />
400<br />
200<br />
0<br />
0 50 100 150 200 250<br />
Wheat <strong>seed</strong> <strong>rate</strong> (<strong>seed</strong>s/m 2 )<br />
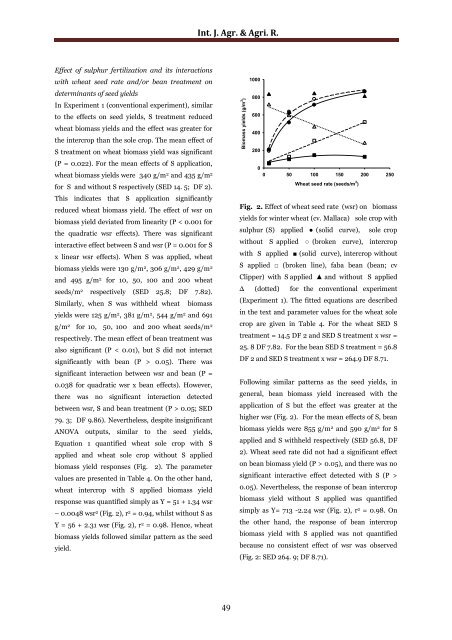
Fig. 2. Effect <strong>of</strong> <strong>wheat</strong> <strong>seed</strong> <strong>rate</strong> (wsr) on biomass<br />
yields for w<strong>in</strong>ter <strong>wheat</strong> (cv. Mallaca) sole crop with<br />
<strong>sulphur</strong> (S) applied ● (solid curve), sole crop<br />
without S applied ○ (broken curve), <strong>in</strong>tercrop<br />
with S applied ■ (solid curve), <strong>in</strong>tercrop without<br />
S applied □ (broken l<strong>in</strong>e), <strong>faba</strong> <strong>bean</strong> (<strong>bean</strong>; cv<br />
Clipper) with S applied ▲ <strong>and</strong> without S applied<br />
∆ (dotted) for the conventional experiment<br />
(Experiment 1). The fitted equations are described<br />
<strong>in</strong> the text <strong>and</strong> parameter values for the <strong>wheat</strong> sole<br />
crop are given <strong>in</strong> Table 4. For the <strong>wheat</strong> SED S<br />
treatment = 14.5 DF 2 <strong>and</strong> SED S treatment x wsr =<br />
25. 8 DF 7.82. For the <strong>bean</strong> SED S treatment = 56.8<br />
DF 2 <strong>and</strong> SED S treatment x wsr = 264.9 DF 8.71.<br />
Follow<strong>in</strong>g similar patterns as the <strong>seed</strong> yields, <strong>in</strong><br />
general, <strong>bean</strong> biomass yield <strong>in</strong>creased with the<br />
application <strong>of</strong> S but the effect was greater at the<br />
higher wsr (Fig. 2). For the mean effects <strong>of</strong> S, <strong>bean</strong><br />
biomass yields were 855 g/m 2 <strong>and</strong> 590 g/m 2 for S<br />
applied <strong>and</strong> S withheld respectively (SED 56.8, DF<br />
2). Wheat <strong>seed</strong> <strong>rate</strong> did not had a significant effect<br />
on <strong>bean</strong> biomass yield (P > 0.05), <strong>and</strong> there was no<br />
significant <strong>in</strong>teractive effect detected with S (P ><br />
0.05). Nevertheless, the <strong>response</strong> <strong>of</strong> <strong>bean</strong> <strong>in</strong>tercrop<br />
biomass yield without S applied was quantified<br />
simply as Y= 713 -2.24 wsr (Fig. 2), r 2 = 0.98. On<br />
the other h<strong>and</strong>, the <strong>response</strong> <strong>of</strong> <strong>bean</strong> <strong>in</strong>tercrop<br />
biomass yield with S applied was not quantified<br />
because no consistent effect <strong>of</strong> wsr was observed<br />
(Fig. 2: SED 264. 9; DF 8.71).<br />
49

![Review on: impact of seed rates and method of sowing on yield and yield related traits of Teff [Eragrostis teff (Zucc.) Trotter] | IJAAR @yumpu](https://documents.yumpu.com/000/066/025/853/c0a2f1eefa2ed71422e741fbc2b37a5fd6200cb1/6b7767675149533469736965546e4c6a4e57325054773d3d/4f6e6531383245617a537a49397878747846574858513d3d.jpg?AWSAccessKeyId=AKIAICNEWSPSEKTJ5M3Q&Expires=1714125600&Signature=3DKrTZrjizu2rBv8MbzfhFrEMY0%3D)


