Missoula Residential Update - April 2018

Create successful ePaper yourself
Turn your PDF publications into a flip-book with our unique Google optimized e-Paper software.
Jan<br />
Feb<br />
Mar<br />
Apr<br />
May<br />
Jun<br />
Jul<br />
Aug<br />
Sep<br />
Oct<br />
Nov<br />
Dec<br />
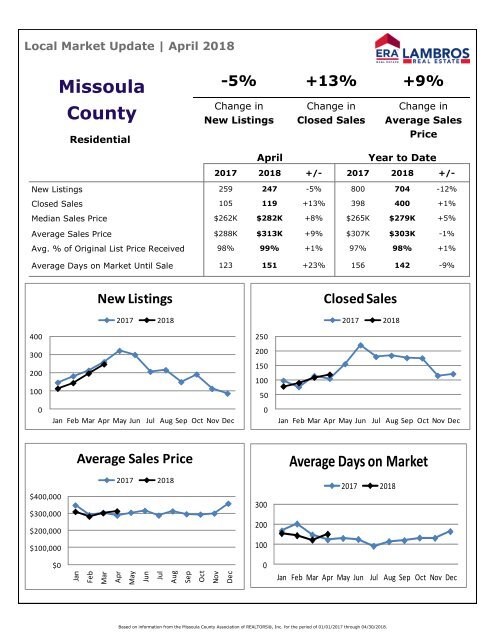
Local Market <strong>Update</strong> | <strong>April</strong> <strong>2018</strong><br />
<strong>Missoula</strong><br />
County<br />
<strong>Residential</strong><br />
-5% +13% +9%<br />
Change in<br />
New Listings<br />
Change in<br />
Closed Sales<br />
Change in<br />
Average Sales<br />
Price<br />
<strong>April</strong><br />
Year to Date<br />
2017 <strong>2018</strong> +/- 2017 <strong>2018</strong> +/-<br />
New Listings 259 247 -5% 800 704 -12%<br />
Closed Sales 105 119 +13% 398 400 +1%<br />
Median Sales Price $262K $282K +8% $265K $279K +5%<br />
Average Sales Price $288K $313K +9% $307K $303K -1%<br />
Avg. % of Original List Price Received 98% 99% +1% 97% 98% +1%<br />
Average Days on Market Until Sale 123 151 +23% 156 142 -9%<br />
New Listings<br />
2017 <strong>2018</strong><br />
Closed Sales<br />
2017 <strong>2018</strong><br />
400<br />
250<br />
300<br />
200<br />
200<br />
100<br />
150<br />
100<br />
50<br />
0<br />
Jan Feb Mar Apr May Jun Jul Aug Sep Oct Nov Dec<br />
0<br />
Jan Feb Mar Apr May Jun Jul Aug Sep Oct Nov Dec<br />
Average Sales Price<br />
Average Days on Market<br />
$400,000<br />
$300,000<br />
$200,000<br />
2017 <strong>2018</strong><br />
300<br />
200<br />
2017 <strong>2018</strong><br />
$100,000<br />
100<br />
$0<br />
0<br />
Jan Feb Mar Apr May Jun Jul Aug Sep Oct Nov Dec<br />
Based on information from the <strong>Missoula</strong> County Association of REALTORS®, Inc. for the period of 01/01/2017 through 04/30/<strong>2018</strong>.