

View - X-ray Optics and Microscopy at Stony Brook
View - X-ray Optics and Microscopy at Stony Brook
View - X-ray Optics and Microscopy at Stony Brook

You also want an ePaper? Increase the reach of your titles
YUMPU automatically turns print PDFs into web optimized ePapers that Google loves.
432 C Jacobsen al et<br />
In scanning microscopy the image is formed point by point in a serial fashion as<br />
the focused probe is moved across the specimen. This method is therefore well suited<br />
to simple electronic detection of the x-<strong>ray</strong>s, <strong>and</strong> consequently the direct digital acquisition<br />
<strong>and</strong> processing of the image. By counting the transmitted photons, inform<strong>at</strong>ion<br />
is h<strong>and</strong>led in an efficient manner with minimal noise. This results in minimising the<br />
radi<strong>at</strong>ion dose to the specimen (Sayre et a1 1977a, b). In addition, a direct measurement<br />
of the absorptivity is obtained <strong>at</strong> each point in the specimen. The absorption coefficient<br />
can then be calcul<strong>at</strong>ed if the thickness is known. Altern<strong>at</strong>ively, the thickness can be<br />
determined if either the composition is known, or images are taken <strong>at</strong> more than one<br />
wavelength.<br />
2. The microscope<br />
The first scanning x-<strong>ray</strong> microscope was built by Horowitz <strong>and</strong> Howell (1972) (see<br />
also Horowitz 1978) almost 15 years ago. Our instrument is based on similar<br />
principles, but it is the first one to incorpor<strong>at</strong>e focusing optics to define a submicron<br />
probe, a tunable monochrom<strong>at</strong>ic soft x-<strong>ray</strong> source for absorptivity measurements <strong>and</strong><br />
direct, computer-based image acquisition <strong>and</strong> processing. The microscope oper<strong>at</strong>es <strong>at</strong><br />
beamline U15 of the ultraviolet ring <strong>at</strong> the N<strong>at</strong>ional Synchrotron Light Source (NSLS).<br />
This beamline uses a toroidal gr<strong>at</strong>ing monochrom<strong>at</strong>or with a resolving power of about<br />
300 to select any desired wavelength in the 1.5-4.5 nm range (Williams <strong>and</strong> Howells<br />
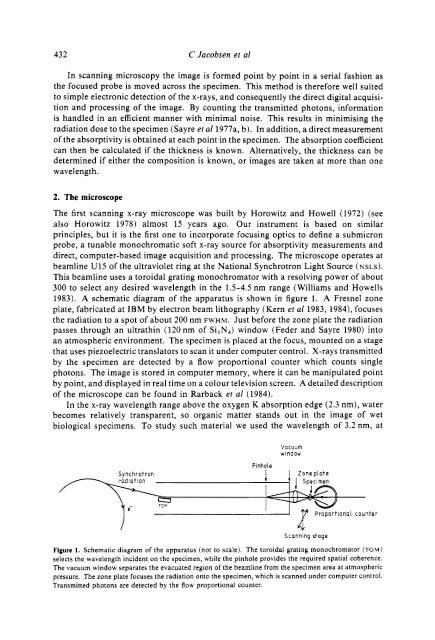
1983). A schem<strong>at</strong>ic diagram of the appar<strong>at</strong>us is shown in figure 1. A Fresnel zone<br />
pl<strong>at</strong>e, fabric<strong>at</strong>ed <strong>at</strong> IBM by electron beam lithography (Kern et al 1983, 1984), focuses<br />
the radi<strong>at</strong>ion to a spot of about 200 nm FWHM. Just before the zone pl<strong>at</strong>e the radi<strong>at</strong>ion<br />
passes through an ultr<strong>at</strong>hin (120 nm of Si3N4) window (Feder <strong>and</strong> Sayre 1980) into<br />
an <strong>at</strong>mospheric environment. The specimen is placed <strong>at</strong> the focus, mounted on a stage<br />
th<strong>at</strong> uses piezoelectric transl<strong>at</strong>ors to scan it under computer control. X-<strong>ray</strong>s transmitted<br />
by the specimen are detected by a flow proportional counter which counts single<br />
photons. The image is stored in computer memory, where it can be manipul<strong>at</strong>ed point<br />
by point, <strong>and</strong> displayed in real time on a colour television screen. A detailed description<br />
of the microscope can be found in Rarback et a1 (1984).<br />
In the x-<strong>ray</strong> wavelength range above the oxygen K absorption edge (2.3 nm), w<strong>at</strong>er<br />
becomes rel<strong>at</strong>ively transparent, so organic m<strong>at</strong>ter st<strong>and</strong>s out in the image of wet<br />
biological specimens. To study such m<strong>at</strong>erial we used the wavelength of 3.2 nm, <strong>at</strong><br />
Vacuum<br />
window<br />
Plnhole<br />
Synchrotron Zone<br />
Specimen<br />
l,<br />
Scannlng stage<br />
Proportional counter<br />
Figure 1. Schem<strong>at</strong>ic diagram of the appar<strong>at</strong>us (not to scale). The toroidal gr<strong>at</strong>ing monochrom<strong>at</strong>or (TGM)<br />
selects the wavelength incident on the specimen, while the pinhole provides the required sp<strong>at</strong>ial coherence.<br />
The vacuum window separ<strong>at</strong>es the evacu<strong>at</strong>ed region of the beamline from the specimen area <strong>at</strong> <strong>at</strong>mospheric<br />
pressure. The zone pl<strong>at</strong>e focuses the radi<strong>at</strong>ion onto the specimen, which is scanned under computer control.<br />
Transmitted photons are detected by the flow proportional counter.