plant genetic resources - Department of Plant Sciences - University ...
plant genetic resources - Department of Plant Sciences - University ...
plant genetic resources - Department of Plant Sciences - University ...

You also want an ePaper? Increase the reach of your titles
YUMPU automatically turns print PDFs into web optimized ePapers that Google loves.
Reproduced from Crop Science. Published by Crop Science Society <strong>of</strong> America. All copyrights reserved.<br />
PALLOTTINI ET AL.: FINGERPRINTING OF YELLOW BEANS 971<br />
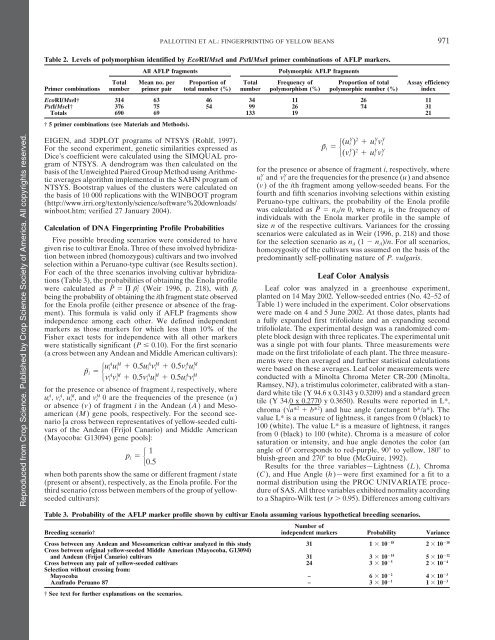
Table 2. Levels <strong>of</strong> polymorphism identified by EcoRI/MseI and PstI/MseI primer combinations <strong>of</strong> AFLP markers.<br />
All AFLP fragments Polymorphic AFLP fragments<br />
Total Mean no. per Proportion <strong>of</strong> Total Frequency <strong>of</strong> Proportion <strong>of</strong> total Assay efficiency<br />
Primer combinations number primer pair total number (%) number polymorphism (%) polymorphic number (%) index<br />
EcoRI/MseI† 314 63 46 34 11 26 11<br />
PstI/MseI† 376 75 54 99 26 74 31<br />
Totals 690 69 133 19 21<br />
† 5 primer combinations (see Materials and Methods).<br />
EIGEN, and 3DPLOT programs <strong>of</strong> NTSYS (Rohlf, 1997).<br />
p˜ i � � (uY i ) 2 � uY i vY i<br />
(vY i ) 2 � uY i vY For the second experiment, <strong>genetic</strong> similarities expressed as<br />
Dice’s coefficient were calculated using the SIMQUAL pro-<br />
i<br />
gram <strong>of</strong> NTSYS. A dendrogram was then calculated on the<br />
basis <strong>of</strong> the Unweighted Paired Group Method using Arithme- for the presence or absence <strong>of</strong> fragment i, respectively, where<br />
uY i and vY tic averages algorithm implemented in the SAHN program <strong>of</strong><br />
NTSYS. Bootstrap values <strong>of</strong> the clusters were calculated on<br />
the basis <strong>of</strong> 10 000 replications with the WINBOOT program<br />
(http://www.irri.org/textonly/science/s<strong>of</strong>tware%20downloads/<br />
winboot.htm; verified 27 January 2004).<br />
i are the frequencies for the presence (u) and absence<br />
(v) <strong>of</strong>theith fragment among yellow-seeded beans. For the<br />
fourth and fifth scenarios involving selections within existing<br />
Peruano-type cultivars, the probability <strong>of</strong> the Enola pr<strong>of</strong>ile<br />
was calculated as P˜ � nA/n 0, where nA is the frequency <strong>of</strong><br />
individuals with the Enola marker pr<strong>of</strong>ile in the sample <strong>of</strong><br />
Calculation <strong>of</strong> DNA Fingerprinting Pr<strong>of</strong>ile Probabilities<br />
Five possible breeding scenarios were considered to have<br />
given rise to cultivar Enola. Three <strong>of</strong> these involved hybridization<br />
between inbred (homozygous) cultivars and two involved<br />
selection within a Peruano-type cultivar (see Results section).<br />
size n <strong>of</strong> the respective cultivars. Variances for the crossing<br />
scenarios were calculated as in Weir (1996, p. 218) and those<br />
for the selection scenario as nA (1 � nA)/n. For all scenarios,<br />
homozygosity <strong>of</strong> the cultivars was assumed on the basis <strong>of</strong> the<br />
predominantly self-pollinating nature <strong>of</strong> P. vulgaris.<br />
For each <strong>of</strong> the three scenarios involving cultivar hybridizations<br />
(Table 3), the probabilities <strong>of</strong> obtaining the Enola pr<strong>of</strong>ile<br />
were calculated as P˜ ��p˜ i<br />
Leaf Color Analysis<br />
Leaf color was analyzed in a greenhouse experiment,<br />
2 i (Weir 1996, p. 218), with p˜ i<br />
being the probability <strong>of</strong> obtaining the ith fragment state observed <strong>plant</strong>ed on 14 May 2002. Yellow-seeded entries (No. 42–52 <strong>of</strong><br />
for the Enola pr<strong>of</strong>ile (either presence or absence <strong>of</strong> the frag- Table 1) were included in the experiment. Color observations<br />
ment). This formula is valid only if AFLP fragments show were made on 4 and 5 June 2002. At those dates, <strong>plant</strong>s had<br />
independence among each other. We defined independent a fully expanded first trifoliolate and an expanding second<br />
markers as those markers for which less than 10% <strong>of</strong> the trifoliolate. The experimental design was a randomized com-<br />
Fisher exact tests for independence with all other markers plete block design with three replicates. The experimental unit<br />
were statistically significant (P � 0.10). For the first scenario was a single pot with four <strong>plant</strong>s. Three measurements were<br />
(a cross between any Andean and Middle American cultivars): made on the first trifoliolate <strong>of</strong> each <strong>plant</strong>. The three measurep˜<br />
i � �<br />
ments were then averaged and further statistical calculations<br />
were based on these averages. Leaf color measurements were<br />
uA i uM i � 0.5uA i vM i � 0.5vA i uM i<br />
vA i vM i � 0.5vA i uM i � 0.5uA i vM i<br />
for the presence or absence <strong>of</strong> fragment i, respectively, where<br />
u<br />
conducted with a Minolta Chroma Meter CR-200 (Minolta,<br />
Ramsey, NJ), a tristimulus colorimeter, calibrated with a stan-<br />
dard white tile (Y 94.6 x 0.3143 y 0.3209) and a standard green<br />
A i , vA i , uM i , and vM i 0 are the frequencies <strong>of</strong> the presence (u)<br />
or absence (v) <strong>of</strong> fragment i in the Andean (A) and Meso-<br />
tile (Y 34.0 x 0.2770 y 0.3650). Results were reported in L*,<br />
chroma (√a* 2 � b* 2 american (M) gene pools, respectively. For the second sce-<br />
nario [a cross between representatives <strong>of</strong> yellow-seeded cultivars<br />
<strong>of</strong> the Andean (Frijol Canario) and Middle American<br />
(Mayocoba: G13094) gene pools]:<br />
) and hue angle (arctangent b*/a*). The<br />
value L* is a measure <strong>of</strong> lightness, it ranges from 0 (black) to<br />
100 (white). The value L* is a measure <strong>of</strong> lightness, it ranges<br />
from 0 (black) to 100 (white). Chroma is a measure <strong>of</strong> color<br />
saturation or intensity, and hue angle denotes the color (an<br />
pi � �<br />
angle <strong>of</strong> 0� corresponds to red-purple, 90� to yellow, 180� to<br />
1<br />
0.5<br />
bluish-green and 270� to blue (McGuire, 1992).<br />
Results for the three variables—Lightness (L), Chroma<br />
when both parents show the same or different fragment i state (C), and Hue Angle (h)—were first examined for a fit to a<br />
(present or absent), respectively, as the Enola pr<strong>of</strong>ile. For the normal distribution using the PROC UNIVARIATE proce-<br />
third scenario (cross between members <strong>of</strong> the group <strong>of</strong> yellowdure <strong>of</strong> SAS. All three variables exhibited normality according<br />
seeded cultivars): to a Shapiro-Wilk test (r � 0.95). Differences among cultivars<br />
Table 3. Probability <strong>of</strong> the AFLP marker pr<strong>of</strong>ile shown by cultivar Enola assuming various hypothetical breeding scenarios.<br />
Number <strong>of</strong><br />
Breeding scenario† independent markers Probability Variance<br />
Cross between any Andean and Mesoamerican cultivar analyzed in this study 31 1 � 10 �18 2 � 10 �18<br />
Cross between original yellow-seeded Middle American (Mayocoba, G13094)<br />
and Andean (Frijol Canario) cultivars 31 3 � 10 �14 5 � 10 �12<br />
Cross between any pair <strong>of</strong> yellow-seeded cultivars 24 3 � 10 �5 2 � 10 �4<br />
Selection without crossing from:<br />
Mayocoba – 6 � 10 �2 4 � 10 �3<br />
Azufrado Peruano 87 – 3 � 10 �1 1 � 10 �3<br />
† See text for further explanations on the scenarios.