Supply Chain Efficiency Explained
How to close the gap between data and productivity in supply chain environments? Learn more about it in this short question and answers from RMG Networks.
How to close the gap between data and productivity in supply chain environments? Learn more about it in this short question and answers from RMG Networks.

You also want an ePaper? Increase the reach of your titles
YUMPU automatically turns print PDFs into web optimized ePapers that Google loves.
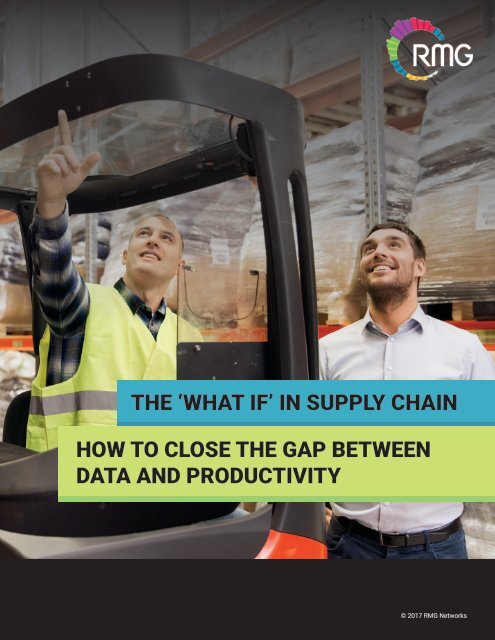
THE ‘WHAT IF’ IN SUPPLY CHAIN<br />
HOW TO CLOSE THE GAP BETWEEN<br />
DATA AND PRODUCTIVITY<br />
© 2017 RMG Networks
TABLE OF CONTENTS<br />
INTRODUCTION .......................................................................................................................................... 3<br />
The Numbers.......................................................................................................................................................... 4<br />
Challenges......................................................................................................................................................... 5<br />
Solution .......................................................................................................................................................... 7<br />
2
INTRODUCTION<br />
Technology continues to revolutionise the supply chain sector with<br />
warehousing, distribution, logistics and transport businesses continuously<br />
innovating and investing billions worldwide each year. However, through many<br />
conversations with C level decision makers and participating in events such<br />
as SCL Hub 2017, several important issues and challenges consistently tend<br />
to surface. What is more intriguing is that these currently very often remain<br />
unresolved, even with all of the investment in new or improved hardware and<br />
software, data analytics and business intelligence. These challenges are not<br />
new, and they often even go undetected due to lack of knowledge in how to<br />
get the most out of systems and technology. Although most decision makers<br />
know something is missing, it is often difficult to identify what that is exactly.<br />
While new and improved powerful management systems for workforce,<br />
warehouse and transport (to name a few) have increasingly driven up<br />
performance through innovations and impact features and functionalities, the<br />
long existing gap between the data these systems generate and turning that<br />
data into real-time actionable insights was highlighted as a major challenge in<br />
many conversations I had at SCL HUB. Many supply chain professionals are<br />
aware of the fact that an ‘invisible’ gap exists between data and productivity,<br />
yet do not necessarily have a clear view on the magnitude of this productivity<br />
gap, what it is caused by or which solutions could close this gap. As such, the<br />
whole problem often becomes unrightfully downplayed and does not receive<br />
enough attention. However, once some of the most important causes and<br />
solutions are being presented to these professionals, it becomes clear how<br />
many valuable opportunities are being lost on a daily basis by not confronting<br />
this gap heads on. This invisible gap suddenly becomes impossible to ignore<br />
or downplay. The focus then shifts from debating whether there is a problem<br />
to finding the most impactful and effective solutions for dealing with the<br />
issues at hand, given the specific context.<br />
Many supply chain<br />
professionals are<br />
aware of the fact<br />
that an ‘invisible’<br />
gap exists<br />
between data and<br />
productivity, yet<br />
do not necessarily<br />
have a clear view<br />
on the magnitude<br />
of this productivity<br />
gap<br />
3
The Numbers<br />
How much is being invested globally in systems, business intelligence and<br />
analytics on a yearly basis? Well… a lot: $3.5 trillion 1 is being spent on IT<br />
systems by companies yearly, while $143 billion 2 is being spent on business<br />
intelligence and analytics.<br />
But the numbers hide a defying and intriguing conf ict …<br />
Yet according to studies, only 27 percent of employees 3 agree that they get<br />
the information they need to help them with their work, while supervisors and<br />
managers are reporting that it takes on average more than 6 days 4 to obtain<br />
performance reports with traditional BI tools. Sixty percent 5 of business and<br />
technology decision makers report concerns with creating and updating<br />
dashboards and the time and effort it takes to do so while 64 percent6<br />
consider it difficult to get clear answers and insights from their dashboards<br />
and metrics.<br />
According to a study from Deloitte only 25% of decision makers and business<br />
leaders say that investments in data analytics and business intelligence has<br />
resulted in considerable gains in competitiveness. To the question whether<br />
these investments have improved performance and competitive position the<br />
answer was:<br />
only 25% of<br />
decision makers<br />
and business<br />
leaders say that<br />
investments in<br />
data analytics<br />
and business<br />
intelligence<br />
has resulted in<br />
considerable gains<br />
in competitiveness<br />
In 3 out of 4 cases, significant improvement is still possible and the<br />
investments have delivered only partial results.<br />
So, the crucial multi billion-dollar question is: what is the missing link here<br />
that could enable companies to bridge the gap between these massive<br />
investments and actual data driven, effective decision making, leading to<br />
more efficient operations and improved competitiveness?<br />
missing link that<br />
could enable<br />
companies<br />
to bridge the<br />
gap between<br />
these massive<br />
investments and<br />
actual data driven,<br />
effective decision<br />
making?<br />
4
Thank you for the insights into your challenges …<br />
One of the main reasons why participating in industry events such as<br />
SCL HUB is simply amazing is that it is one of the only places where<br />
you find so many C level executives and knowledgeable decision<br />
makers providing you with insights into their challenges, doubt and<br />
most pressing quests for productivity. This provides professionals<br />
such as myself with insights into what could make their business<br />
run better structurally, and which obstacles companies face to make<br />
that become a reality. But here is the best thing: I can safely say that<br />
there are sophisticated yet simple solutions to many of these most<br />
pressing challenges and they are all about real-time visualisation of<br />
performance metrics and engaging internal communications.<br />
Asking the right questions … ticking the right tick boxes?<br />
Let me just ask you some very simple questions, and if by the end of<br />
this article you think “those are the challenges I am faced with daily,”<br />
then know this: the solutions exist, and it is a visual one.<br />
• What if systems were no longer disparate data sources?<br />
A crucial problem many organisations face is the fact that operational<br />
data is often generated by disparate and unconnected systems,<br />
each speaking their own language and not communicating with each<br />
other. This makes it very complicated to get a clear overview of the<br />
performance within the department or company hence making it<br />
difficult to manage performance in an efficient and objective way<br />
without investing a tremendous amount of time into trying to achieve<br />
the right insights for good decision making. What if you had a way to<br />
unify the data from all those systems into one comprehensive<br />
cross-functional dashboard?<br />
• What if once unified, these sources could combine to reflect<br />
critical action points for teams?<br />
Reports and dashboards often still require more effort to get to the<br />
actual insights and understand what next steps to take. What if rather<br />
than just receiving reports, you could benefit from an automated way<br />
of seeing in which areas performance is on or under target, and could<br />
further more receive intelligent automated inputs indicating to your<br />
employees, supervisors and managers what the best actions to take<br />
are based on a set of pre-defined parameters.<br />
There are<br />
sophisticated yet<br />
simple solutions<br />
to many of these<br />
most pressing<br />
challenges and<br />
they are all<br />
about real-time<br />
visualisation of<br />
performance<br />
metrics and<br />
engaging internal<br />
communications<br />
What if you<br />
had a way to<br />
unify the data<br />
from all those<br />
systems into one<br />
comprehensive<br />
cross-functional<br />
dashboard?<br />
5
• What if all that was presented to you and your whole team was in<br />
real-time?<br />
The typical scenario of monthly performance meetings where all<br />
KPIs get put under the microscope and discussed is all too familiar.<br />
However, all too often these meetings occur far too late when the<br />
facts and past performance cannot be changed. What if you had clear<br />
insightful and real-time performance metrics presented to every staff<br />
member, supervisor and manager at all times, allowing actions to<br />
be taken on the spot, assuring that at the end of the month KPIs are<br />
in green rather than red? What if problems are detected and tackled<br />
when they can be instantaneously solved rather than when they can no<br />
longer be corrected?<br />
• What if business-critical incidents could be push messaged to the<br />
management’s phones, desktops or any other appropriate channel in<br />
real-time?<br />
Provide real-time insights when and where your employees need it,<br />
no matter where they are. Provide them with the exact personalised<br />
performance metrics that are relevant to them anywhere at any time<br />
via desktop, smartphone or tablet. That is powerful performance<br />
management.<br />
What if at the end<br />
of the month KPIs<br />
are in green rather<br />
than red?<br />
Provide real-time<br />
insights when<br />
and where your<br />
employees need<br />
it, no matter<br />
where they are<br />
6
• What if a manager would “walk the department” instead of trying<br />
to understand old data in an office?<br />
Rather than spending time trying to build reports and understand what<br />
is happening on the work floor from a distance, provide the real-time<br />
actionable insights directly to your managers, anytime, anywhere so<br />
that instead, they can walk the floor solving issues or taking advantage<br />
of opportunities rather than spend their time looking for them in<br />
outdated reports. No matter if it is two hours or three days, any key<br />
performance metric measurement that is not reflective of what is<br />
happening now is old and, therefore, only partially relevant and of<br />
lower value.<br />
• What if employees were more empowered and engaged to deliver<br />
better stats and consistently improve?<br />
By providing people with access and insights into their own<br />
personal performance metrics and making performance fun through<br />
gamification, a new dynamic is created within the company leading<br />
to a culture of transparency, empowerment, engagement and<br />
performance. What if that was not a utopia but a choice you had<br />
today?<br />
No matter if it<br />
is two hours or<br />
three days, any<br />
key performance<br />
metric<br />
measurement that<br />
is not reflective of<br />
what is happening<br />
now is old and,<br />
therefore, only<br />
partially relevant<br />
and of lower value<br />
The solution being able to tick the “yes you can” tick box of each of the<br />
above “what if” questions is: real-time, intelligent visualisation of data<br />
and content. I hear many of you think: “Well we have reporting tools<br />
and dashboards in our company”. You might. But real-time, intelligent<br />
visualisation of data is something very different all together. It allows<br />
employees on all levels to have a clear insight into their individual and<br />
team’s performance across activities and provides actionable insights<br />
as well as solutions to any issue or opportunity arising, any time and<br />
from anywhere. Here is an example of how that works in this case<br />
study on Stanley Black & Decker.<br />
Real-time,<br />
intelligent<br />
visualisation<br />
of data allows<br />
employees on all<br />
levels to have a<br />
clear insight into<br />
their individual<br />
and team’s<br />
performance<br />
across activities<br />
7
“I want to drastically boost efficiency by ticking<br />
all the checkboxes to the six questions above?”<br />
Then come talk to RMG…<br />
Email: sales@rmgnetworks.com<br />
Number: +44 203 868 6930<br />
Tower 42, 14th Floor, London, EC2N 1HQ<br />
*Sources:<br />
1. Gartner Industry Projection - http://www.gartner.com/newsroom/id/3482917<br />
2. www.thoughtspot.com/blog/15-game-changing-bi-stats-2015 Pringle & Company<br />
3. Gallup Study – Amid Rapid-Fire Workplace Change, Pulse Surveys Emerge by Annamarie Mann and Jim Harter<br />
4. Aberdeen Group Study - http://blog.predie.com/2016/05/19/can-notebooks-be-successors-of-traditional-bi-tools/<br />
5. Forrester Research/ www.thoughtspot.com/blog/15-game-changing-bi-stats-2015<br />
6. Forrester Research/www.thoughtspot.com/blog/15-game-changing-bi-stats-2015<br />
7. Bain & Company