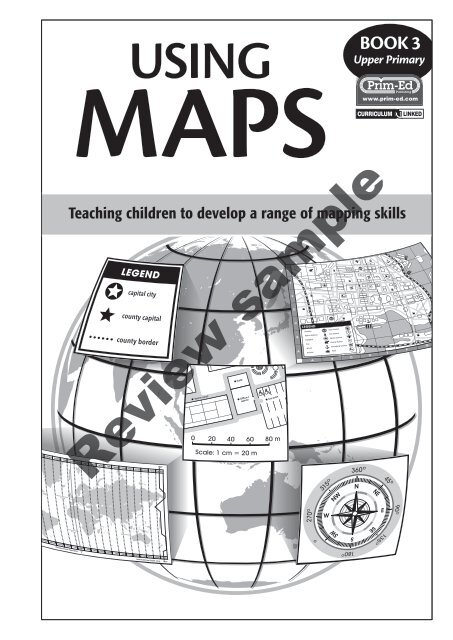
PR-6627IRE Using Maps - Book 3

You also want an ePaper? Increase the reach of your titles
YUMPU automatically turns print PDFs into web optimized ePapers that Google loves.
Review sample
<strong>Using</strong> <strong>Maps</strong><br />
(<strong>Book</strong> 3)<br />
Published by Prim-Ed Publishing, 2017<br />
Copyright © Clare Way 2017<br />
ISBN 978-1-84654-917-5<br />
<strong>PR</strong>–6627<br />
Titles in this series:<br />
<strong>Using</strong> <strong>Maps</strong> (<strong>Book</strong> 1)<br />
<strong>Using</strong> <strong>Maps</strong> (<strong>Book</strong> 2)<br />
<strong>Using</strong> <strong>Maps</strong> (<strong>Book</strong> 3)<br />
Copyright Notice<br />
A number of pages in this book are<br />
worksheets. The publisher licenses the<br />
individual teacher who purchased this<br />
book to photocopy these pages to hand<br />
out to pupils in their own classes.<br />
Except as allowed under the Copyright Act<br />
1968, any other use (including digital and<br />
online uses and the creation of overhead<br />
transparencies or posters) or any use<br />
by or for other people (including by or<br />
for other teachers, pupils or institutions)<br />
is prohibited. If you want a licence to<br />
do anything outside the scope of the<br />
BLM licence above, please contact the<br />
Publisher.<br />
This information is provided to clarify the<br />
limits of this licence and its interaction<br />
with the Copyright Act.<br />
For your added protection in the case of<br />
copyright inspection, please complete the<br />
form below. Retain this form, the complete<br />
original document and the invoice or<br />
receipt as proof of purchase.<br />
Name of Purchaser:<br />
Date of Purchase:<br />
Supplier:<br />
School Order# (if applicable):<br />
Signature of Purchaser:<br />
Although all care has been taken in their<br />
production, maps used in this series<br />
should be regarded as representative only.<br />
Review sample<br />
Internet websites<br />
In some cases, websites or specific URLs may be recommended. While these are checked and rechecked at the time of publication,<br />
the publisher has no control over any subsequent changes which may be made to webpages. It is strongly recommended that the class<br />
teacher checks all URLs before allowing pupils to access them.<br />
View all pages online<br />
Website: www.prim-ed.com<br />
Email: sales@prim-ed.com
Teachers Notes<br />
Foreword<br />
Help your class discover their inner compass as you guide them through the wonderful world of maps!<br />
<strong>Using</strong> <strong>Maps</strong> is a three-book series to teach primary school pupils how to use maps and to develop a range of mapping<br />
skills.<br />
TITLES IN THIS SERIES ARE:<br />
❂ <strong>Using</strong> <strong>Maps</strong> <strong>Book</strong> 1 (Years 1/2 and 1st/2nd Classes)<br />
❂ <strong>Using</strong> <strong>Maps</strong> <strong>Book</strong> 2 (Years 3/4 and 3rd/4th Classes)<br />
❂ <strong>Using</strong> <strong>Maps</strong> <strong>Book</strong> 3 (Years 5/6 and 5th/6th Classes)<br />
Contents<br />
Teachers Notes................................................................. iv–vi<br />
Development Activities Section 1.......................................vii–ix<br />
Development Activities Section 2....................................... ix–xi<br />
Resources...................................................................... xii–xxi<br />
Glossary......................................................................xxii–xxiii<br />
Scope and Sequence Charts (England)........................ xxiv–xxv<br />
Scope and Sequence Charts (Republic of Ireland).......xxvi–xxvii<br />
Pupil Checklist Section 1................................................... xxviii<br />
Pupil Checklist Section 2.....................................................xxix<br />
Links to Other Curriculum Areas...........................................xxx<br />
SECTION 1 (YEAR 5/5TH CLASS) ACTIVITIES<br />
Different Views................................................................. 1–2<br />
Identifying <strong>Maps</strong>............................................................... 3–4<br />
Choosing <strong>Maps</strong>.................................................................... 5<br />
<strong>Using</strong> an Atlas...................................................................... 6<br />
Grid <strong>Maps</strong>: a Zoo.............................................................. 7–8<br />
Grid <strong>Maps</strong>: a School....................................................... 9–10<br />
Grid <strong>Maps</strong>: a Classroom................................................ 11–12<br />
Street <strong>Maps</strong>.................................................................. 13–14<br />
Directional Language......................................................... 15<br />
A Map Legend.................................................................... 16<br />
Reading a Map............................................................. 17–18<br />
Creating a Map.................................................................. 19<br />
The Compass Rose............................................................. 20<br />
Map Features: Madagascar........................................... 21–22<br />
Map Scales: Tasmania................................................... 23–24<br />
Latitude and Longitude................................................. 25–26<br />
Hemispheres, Tropics and Circles .................................. 27–28<br />
Stormy Weather............................................................ 29–30<br />
Describing Locations.......................................................... 31<br />
Continent Research............................................................ 32<br />
Assessment 1: Different Types of <strong>Maps</strong>................................. 33<br />
Assessment 2: Reading a Map............................................ 34<br />
Assessment 3: Locating Places............................................ 35<br />
Assessment 4: Rainfall – Australia....................................... 36<br />
SECTION 2 (YEAR 6/6TH CLASS) ACTIVITIES<br />
<strong>Maps</strong> and Scales.......................................................... 37–38<br />
<strong>Using</strong> Scale and Direction............................................. 39–40<br />
Drawing a Map to Scale................................................ 41–42<br />
Drawing to Scale – Enlarging.............................................. 43<br />
Drawing to Scale – Reducing.............................................. 44<br />
Cartesian Coordinate System – One Quadrant..................... 45<br />
Cartesian Coordinate System – Four Quadrants................... 46<br />
Cartesian Plane: Island Map.......................................... 47–48<br />
Cartesian Plane: Map of Victoria.................................... 49–50<br />
Physical Features: Asia.................................................. 51–52<br />
Physical Features: Europe............................................. 53–54<br />
World Temperatures...................................................... 55–56<br />
World Time Zones......................................................... 57–58<br />
Country Population and Density.................................... 59–60<br />
World Agriculture and Resources................................... 61–62<br />
World Markets.............................................................. 63–64<br />
World Pollution Index.................................................... 65–66<br />
Australian Population and Cultural Diversity................... 67–68<br />
Assessment 1: Cartesian Plane Park Map............................. 69<br />
Assessment 2: <strong>Using</strong> Scales................................................ 70<br />
Assessment 3: From a Table to a Map.................................. 71<br />
Assessment 4: Population and Location............................... 72<br />
ANSWERS 73–77<br />
Review sample<br />
315º<br />
NW<br />
360º<br />
N<br />
NE<br />
45º<br />
270º<br />
W<br />
90º<br />
E<br />
SW<br />
SE<br />
225º<br />
135º<br />
180º<br />
S<br />
Prim-Ed Publishing – www.prim-ed.com iii 978-1-84654-917-5 <strong>Using</strong> <strong>Maps</strong><br />
BOOK 3
Teachers Notes<br />
Learning the conventions of mapping skills is akin<br />
to learning to read. Once they are mastered, the<br />
understanding of the maps follows. Mapping literacy is<br />
important in all areas of the geography curriculum. It<br />
relates not simply to the decoding of maps but to the<br />
understanding of them. As in English comprehension,<br />
there are literal, inferential and applied questions that<br />
may be asked of maps.<br />
Comparing different types of maps of the same<br />
area and maps from different eras and from different<br />
perspectives, promotes discussion of how things have<br />
changed over time and how the information from one<br />
map helps us understand the reasons for information in<br />
another; e.g. the spread of population in a place related<br />
to its physical features.<br />
Why Teach Mapping Skills?<br />
The Skills of Mapping<br />
Examining maps promotes questioning which leads to<br />
research.<br />
Establishing the integrity and validity of maps promotes<br />
discernment in the choice of resources for research.<br />
<strong>Maps</strong> can be used to show evidence of research and<br />
as support for arguments. The ease with which data on<br />
maps can be examined helps the reader to reflect on<br />
and evaluate the information and to make informed<br />
decisions and judgements.<br />
Delivering the results of investigations and research<br />
with maps allows the information to be given in context,<br />
related to place, and makes it available to a wider<br />
audience.<br />
Mapping literacy is developed through learning the skills required to create a map, to add data and information, and<br />
to analyse the information supplied.<br />
Different Views<br />
A map is generally accepted as being a plan of an area:<br />
a vertical or bird’s-eye view in which the viewer is directly<br />
above the area being represented. Everything can be<br />
seen and the spatial relationships among features is<br />
accurately portrayed.<br />
Oblique views are also taken from above, but not<br />
directly above. The image is presented at an angle, so<br />
(depending on the height) not all things can be seen. It<br />
is not possible to accurately judge relationships among<br />
features.<br />
Horizontal views are taken at ground level where only<br />
features in the direct line of sight can be seen.<br />
Pupils of all ages should be able to recognise the<br />
difference between the three views. Older pupils should<br />
appreciate that vertical views are the best choice for<br />
maps.<br />
Direction<br />
Knowledge of the four cardinal directions (north, south,<br />
east, west) and later the four ordinal directions (northeast,<br />
north-west, south-east, south-west) is essential in<br />
creating and reading maps. Pupils will progress to learn<br />
that the ordinal directions are described with north or<br />
south coming before east or west.<br />
Pupils also use natural features and knowledge of the<br />
Earth’s movement in relation to the sun, to orientate<br />
themselves and features around them.<br />
Review sample<br />
W<br />
NW<br />
N<br />
NE<br />
E<br />
oblique view<br />
vertical (aerial/<br />
bird’s-eye)<br />
horizontal view<br />
SW<br />
SE<br />
S<br />
<strong>Using</strong> <strong>Maps</strong> 978-1-84654-917-5 iv Prim-Ed Publishing – www.prim-ed.com<br />
BOOK 3
Teachers Notes<br />
Location and Grid-references<br />
Pupils will move from locating and placing features somewhere within a square, labelled with a ‘letter, number’ grid,<br />
to using the labelled lines of latitude and longitude. Lines of latitude are parallel to each other with only the equator<br />
dividing the globe in half. Lines of longitude meet at the poles and are furthest apart from each other at the equator.<br />
Lines of latitude are labelled N or S, relating to their position north or south of the equator. Lines of longitude are<br />
labelled E or W, relating to their position east or west of the prime meridian.<br />
Pupils learn that representing a map of the globe on paper results in distortion. Different projections show slightly<br />
different shapes of the land.<br />
Scale<br />
Pupils learn that in a map which is a scaled-down image of the place it represents, everything has been reduced by the<br />
same factor. They consider potential problems of using a map in which features are not to scale. They interpret scales<br />
and calculate real distances, using a given scale.<br />
Pupils use the line diagram scale and ratio scale.<br />
0 30 60 90 120<br />
0 1 2 3 4<br />
150 km<br />
5cm<br />
1:200,000<br />
Pupils learn that the amount of detail on a map is related to scale. The larger the scale, the larger the map for a given<br />
area so the greater the amount of detail that can be put on it.<br />
A large-scale map covers a smaller area so the<br />
ratio of the scale is smaller; e.g. 1:25<br />
A small-scale map covers a larger area so the<br />
ratio of the scale is greater; e.g. 1:250<br />
Review sample<br />
Prim-Ed Publishing – www.prim-ed.com v 978-1-84654-917-5 <strong>Using</strong> <strong>Maps</strong><br />
BOOK 3
BOOK 3<br />
A SENSE OF<br />
PLACE<br />
BOOK 3<br />
routes on maps.<br />
conventions.<br />
environments.<br />
physical features.<br />
WEATHER,<br />
ENVIRONMENTAL<br />
CLIMATE AND<br />
AWARENESS<br />
ATMOSPHERE<br />
of the world.<br />
resources.<br />
Teachers Notes<br />
Interpreting legends<br />
Pupils learn that legends are the key to unlocking the information provided on a map. Features on the ground are<br />
represented on a map in three main ways: point, line, area. The weight of shading of an area gives additional information.<br />
Church points – individual features<br />
Road lines – roads, boundaries,<br />
pathways<br />
Forest area – expanse of land<br />
weight 0 –100 of shading – difference<br />
in height, depth, density<br />
Traffic lights<br />
Railway<br />
Sea<br />
100 –200<br />
Library<br />
Adding Features<br />
Pupils learn that moving features are not included<br />
on maps—e.g. people, animals, traffic—and not all<br />
stationary features are included. Exactly what is included<br />
depends on the scale and purpose of the map.<br />
Adding Statistics<br />
River<br />
Information relating to numbers can be added to a map;<br />
e.g. population density can be represented by single<br />
symbols equivalent to any number, or different weights<br />
of colour shading.<br />
Format of the <strong>Book</strong><br />
Desert<br />
Adding Icons<br />
Identifying the location of resources or events can be<br />
done with icons as in a weather map.<br />
Adding Colour<br />
<strong>Using</strong> <strong>Maps</strong> has been written to develop skills so that maps as a resource<br />
for finding information and as a tool for communicating information and<br />
ideas, can be used to their full potential in the geography curriculum.<br />
❂❂<br />
Pages are mainly presented in pairs, with a map and a page of related<br />
activities focusing on a combination of mapping skill development and<br />
mapping literacy.<br />
❂❂<br />
The purpose of the development activities (Section 1 pages vii–ix; Section<br />
2 pages ix–xi) is for pupils to develop their mapping skills and literacy with<br />
reference to the local area.<br />
❂❂<br />
The scope and sequence charts (Section 1 pages xxiv and xxv; Section 2<br />
pages xxvi and xxvii) highlight the curriculum links that are being developed<br />
with each activity.<br />
❂❂<br />
Teacher resources (pages xii–xxi) provide templates of useful charts and<br />
maps.<br />
❂❂<br />
The mapping skills pupil checklist (Section 1 page xxviii; Section 2 page xxix)<br />
offers a way to record each pupil’s performance of the skills.<br />
❂❂<br />
A glossary of mapping-related vocabulary (pages xxii and xxiii) provides<br />
simple explanations of frequently used words.<br />
❂❂<br />
Links to other curriculum areas (page xxx) offers ideas and activities based<br />
on mapping skills that cover a variety of different learning areas.<br />
200 –500<br />
Different colours can be used to show how different<br />
levels or groups of the same feature are spread over<br />
the mapped area; e.g. climate and vegetation, rainfall,<br />
sunshine.<br />
Teachers Resource – <strong>Book</strong> 3<br />
10° N<br />
0°<br />
10° S<br />
20° S<br />
30° S<br />
40° S<br />
50° S<br />
Map of South America<br />
70° 60° 40 W<br />
80° 50W 90° 60W 100° 70W 80W Teachers Resource – <strong>Book</strong> 3<br />
110° W 100° W 90° W 80° W 70° W 60° W 50° W<br />
10<br />
10° N<br />
0°<br />
10° S<br />
20° S<br />
30° S<br />
40° S<br />
50° S<br />
<strong>Using</strong> <strong>Maps</strong> 978-1-84654-917-5 xx Prim-Ed Publishing – www.prim-ed.com<br />
<strong>Using</strong> <strong>Maps</strong> 978-1-84654-917-5 xxiv Prim-Ed Publishing – www.prim-ed.com<br />
BOOK 3<br />
Scope and<br />
Sequence Chart –<br />
Section 1 – Year 5<br />
(England)<br />
PAGE TITLE<br />
Glossary<br />
aerial view a view of a place or object from high above, either directly or at an angle<br />
Antarctic Circle the line of latitude at approximately 66º south of the Equator<br />
Arctic Circle the line of latitude at approximately 66º north of the Equator<br />
atlas a book using maps to i lustrate information relating to the world and human influences upon it<br />
cardinal directions north, south, east, west<br />
Cartesian coordinate a grid of numbered horizontal and vertical lines a lowing location to be determined by<br />
system<br />
coordinates<br />
cartographer a person who draws maps<br />
compass rose a diagram on a map showing in which direction north lies<br />
continent one of the world’s seven main continuous expanses of land<br />
coordinates a set of numbers representing the horizontal and vertical lines of a Cartesian grid<br />
cyclone tropical storm developing over the Indian Ocean and the South Pacific Ocean typica ly between<br />
November and April<br />
direction the location of one feature relative to another, or the course along which something moves or<br />
extends<br />
distance the measured space between locations<br />
economic (or showing information about what a country produces or grows, using symbols or colours<br />
resource) map<br />
equator the line of latitude at 0º that divides the globe into the northern and southern hemispheres<br />
frigid zone the areas of the globe between the Arctic Circle and the North Pole in the northern hemisphere<br />
and the Antarctic Circle and the South Pole in the southern hemisphere<br />
grid reference a labe led grid of horizontal and vertica lines a lowing location within an area to be determined<br />
system<br />
by a pair of letter/number coordinates<br />
hemisphere half of Earth, divided into northern and southern hemispheres (halves) by the equator<br />
horizontal view from eye level<br />
hurricane tropical storm developing over the Atlantic and north-east Pacific oceans typica ly between<br />
June and November each year<br />
International Date the line of longitude at 180º east and west of the Prime meridian; places immediately to its<br />
Line<br />
west are 24 hours ahead of places immediately to its east<br />
legend the key to unlocking the information represented on a map; using point, line or area<br />
representations<br />
line scale a linear diagram showing the link between distance on the ground and distance on the map<br />
lines of latitude the para lel horizontal lines running across the globe, decreasing in diameter from the equator<br />
to the North Pole and the equator to the South Pole<br />
lines of longitude the vertical lines running from pole to pole, the distance between them expanding between<br />
each pole and the equator where the distance is at its greatest; a l lines bisect the globe into<br />
hemispheres<br />
location the exact place, identifiable by coordinates, where a feature exists (absolute) or the place,<br />
identifiable by direction, where one feature exists in relation to another (relative)<br />
managed features features on a map that may appear natural but require maintenance; e.g. parks and gardens<br />
Review sample<br />
<strong>Using</strong> <strong>Maps</strong> 978-1-84654-917-5 xxvi Prim-Ed Publishing – www.prim-ed.com<br />
BOOK 3<br />
<strong>Using</strong> <strong>Maps</strong> 978-1-84654-917-5 xxii Prim-Ed Publishing – www.prim-ed.com<br />
NATIONAL CURRICULUM FOR ENGLAND – GEOGRAPHY – KEY STAGE 2<br />
LOCATIONAL KNOWLEDGE HUMAN AND PHYSICAL GEOGRAPHY GEOGRAPHICAL SKILLS AND FIELDWORK<br />
Locate the world’s<br />
countries, using maps<br />
to focus on Europe and<br />
North and South America,<br />
concentrating on their<br />
environmental regions,<br />
key physical and human<br />
characteristics, countries<br />
and major cities.<br />
Identify the position and<br />
significance of latitude,<br />
longitude, Equator,<br />
Northern Hemisphere,<br />
Southern Hemisphere,<br />
the Tropics of Cancer<br />
and Capricorn, Arctic and<br />
Antarctic Circle, the Prime/<br />
Greenwich Meridian and<br />
time zones.<br />
Describe and understand<br />
key aspects of physical<br />
geography, including:<br />
climate zones, biomes and<br />
vegetation belts, rivers,<br />
mountains, volcanoes and<br />
earthquakes and the water<br />
cycle.<br />
Describe and understand<br />
key aspect of human<br />
geography, including: types<br />
of se tlement and land<br />
use, economic activity<br />
including trade links and<br />
the distribution of natural<br />
resources including energy,<br />
food, minerals and water.<br />
Use maps, atlases, globes<br />
and digital/computer<br />
mapping to locate<br />
countries and describe<br />
features studied.<br />
Use the eight points of<br />
a compass, four and<br />
six-figure grid references,<br />
symbols and keys to build<br />
their knowledge of the<br />
United Kingdom and the<br />
wider world.<br />
Teachers Resource – <strong>Book</strong> 3<br />
2–3 Di ferent Views ✔<br />
4–5 Identifying <strong>Maps</strong> ✔<br />
6 Choosing <strong>Maps</strong> ✔<br />
7 <strong>Using</strong> an Atlas ✔ ✔<br />
8–9 Grid <strong>Maps</strong>: a Zoo ✔ ✔<br />
10–11 Grid <strong>Maps</strong>: a School ✔ ✔<br />
12–13 Grid <strong>Maps</strong>: a Classroom ✔ ✔<br />
14–15 Street <strong>Maps</strong> ✔ ✔<br />
16 Directional Language ✔ ✔<br />
17 A Map Legend ✔<br />
18–19 Reading a Map ✔ ✔<br />
20 Creating a Map ✔<br />
21 The Compass Rose ✔<br />
22–23 Map Features: Madagascar ✔ ✔ ✔<br />
24–25 Map Scales: Tasmania ✔ ✔<br />
26–27 Latitude And Longitude ✔ ✔ ✔<br />
28–29 Hemispheres, Tropics and Circles ✔ ✔ ✔ ✔<br />
30–31 Stormy Weather ✔ ✔<br />
32 Describing Locations ✔ ✔ ✔<br />
33 Continent Research ✔ ✔ ✔ ✔ ✔<br />
34–37 Assessment Activities ✔ ✔ ✔ ✔ ✔<br />
Scope and<br />
Sequence Chart –<br />
Section 1 – 5th<br />
Class (Republic<br />
of Ireland)<br />
PAGE TITLE<br />
Become familiar with the distinctive<br />
natural and human features of<br />
some places in Europe and other<br />
parts of the world.<br />
Begin to develop an understanding<br />
of the names and relative location<br />
of some natural and human<br />
features of Europe and the world.<br />
Estimate and measure distances<br />
and establish cardinal directions<br />
during exploration of the locality.<br />
CURRICULUM FOR REPUBLIC OF IRELAND – GEOGRAPHY – 5th/6th CLASSES<br />
A SENSE OF SPACE USING PICTURES, MAPS AND GLOBES MAPS AND GLOBES<br />
Develop some awareness of<br />
directions in wider environments.<br />
Use and record directions and<br />
Develop familiarity with, and<br />
engage in practical use of, maps<br />
and photographs of a variety of<br />
scales and purposes.<br />
Develop an understanding of and<br />
use common map features and<br />
Use maps to record routes and<br />
directions in the locality and wider<br />
Construct some simple maps and<br />
models of natural and human<br />
features in the local environment.<br />
Compare maps, globes, aerial<br />
photographs, sate lite photographs<br />
and othe remotely sensed images.<br />
Recognise key lines of latitude and<br />
longitude on the globe.<br />
PHYSICAL FEATURES OF<br />
EUROPE AND THE WORLD<br />
2–3 Di ferent Views ✔<br />
4–5 Identifying <strong>Maps</strong> ✔ ✔ ✔<br />
6 Choosing <strong>Maps</strong> ✔ ✔ ✔<br />
7 <strong>Using</strong> an Atlas ✔<br />
8–9 Grid <strong>Maps</strong>: a Zoo ✔ ✔<br />
10–11 Grid <strong>Maps</strong>: a School ✔ ✔ ✔ ✔<br />
12–13 Grid <strong>Maps</strong>: a Classroom ✔ ✔<br />
14–15 Street <strong>Maps</strong> ✔ ✔<br />
16 Directional Language ✔ ✔<br />
17 A Map Legend ✔<br />
18–19 Reading a Map ✔ ✔ ✔<br />
20 Creating a Map ✔ ✔<br />
21 The Compass Rose ✔ ✔<br />
22–23 Map Features: Madagascar ✔ ✔ ✔ ✔ ✔ ✔<br />
24–25 Map Scales: Tasmania ✔ ✔ ✔ ✔ ✔<br />
26–27 Latitude And Longitude ✔ ✔ ✔ ✔ ✔<br />
28–29 Hemispheres, Tropics and Circles ✔ ✔ ✔ ✔ ✔<br />
30–31 Stormy Weather ✔ ✔<br />
32 Describing Locations ✔ ✔ ✔ ✔<br />
33 Continent Research ✔ ✔<br />
34–37 Assessment Activities ✔ ✔ ✔ ✔ ✔ ✔ ✔ ✔ ✔ ✔ ✔<br />
Learn about a sma l number of the<br />
major natural features of Europe.<br />
Teachers Resource – <strong>Book</strong> 3<br />
Become familiar with the names<br />
and approximate location of a<br />
sma l number of major world<br />
Become aware of the<br />
characteristics of some major<br />
climatic regions in di ferent parts<br />
Foster an appreciation of the ways<br />
in which people use the Earth’s<br />
Use fieldwork to observe,<br />
measure, record and<br />
presen the human and<br />
physical features in the<br />
local area using a range of<br />
methods, including sketch<br />
maps, plans and graphs<br />
and digital technologies.<br />
<strong>Using</strong> <strong>Maps</strong> 978-1-84654-917-5 vi Prim-Ed Publishing – www.prim-ed.com<br />
BOOK 3
Teachers Notes<br />
Development Activities<br />
Section 1 (Year 5/5th Class)<br />
DIFFERENT VIEWS – PAGES 1 AND 2<br />
STREET MAPS – PAGES 13 AND 14<br />
❂❂<br />
Photograph objects from different perspectives and<br />
angles. See how many different images of the same<br />
object can be taken. Display them in groups and compare<br />
and contrast. Group them into three categories: vertical<br />
(directly above or below), oblique (at an angle, up or<br />
down) and horizontal (at eye level).<br />
❂❂<br />
Each pupil secretly sketches a line drawing of an everyday<br />
object as viewed from directly above. Collate all sketches<br />
to create a picture puzzle quiz. How many sketches can<br />
each pupil correctly name?<br />
IDENTIFYING MAPS – PAGES 3 AND 4<br />
❂❂<br />
Find and display different maps of the same location.<br />
Compare and contrast the maps. Discuss the purpose and<br />
intended audience of each map.<br />
❂❂<br />
Suggest different maps of the local area that would be<br />
useful for different audiences; e.g. a public transport map<br />
highlighting railway lines and stations, bus routes and bus<br />
stops; a sports facilities map highlighting leisure centres,<br />
sports clubs and safe swimming beaches; a shopping<br />
map highlighting shopping centres and commercial<br />
areas.<br />
CHOOSING MAPS – PAGE 5<br />
❂❂<br />
Collect a selection of different types of maps of any<br />
location. Group the class and give a different type of map<br />
to each group. Allow a set time for groups to list possible<br />
uses for their map. When the time is up, groups exchange<br />
maps and lists, and add more suggestions to the list for<br />
their new map. Continue until all groups have seen all<br />
maps and had the opportunity to add new uses for each.<br />
USING AN ATLAS – PAGE 6<br />
❂❂<br />
Make a collection of different atlases. Group the class<br />
and give a different atlas to each group. Groups create an<br />
explosion chart that reveals all the sections of their atlas<br />
and the information it provides. For each section, pupils<br />
suggest occasions when the information would be useful<br />
to them.<br />
GRID MAPS – PAGES 7 TO 12<br />
❂❂<br />
On plain paper, pupils draw a mud map of a familiar<br />
location with a selection of interesting features. Add<br />
colour and detail to the map. On squared paper of the<br />
same size, pupils draw a grid map of the same location<br />
with the same features. Pupils compare and contrast their<br />
maps, discussing the information they provide and their<br />
potential uses and audiences.<br />
❂❂<br />
View a collection of grid maps from local community<br />
places. Discuss the value of each and any improvements<br />
that could be made.<br />
❂❂<br />
Piece together and display pages of a local street directory.<br />
Highlight community features and their proximity to the<br />
school and pupils’ homes. Identify different routes pupils<br />
can take from one location to another.<br />
❂❂<br />
View street maps of national or international cities with<br />
iconic buildings, structures and other features marked.<br />
Identify and discuss the locations of transport links and<br />
other features. Identify a route to view chosen tourist<br />
destinations.<br />
DIRECTIONAL LANGUAGE – PAGE 15<br />
❂❂<br />
List a number (between eight and twelve) of major<br />
features around the school and its grounds. Write the<br />
name of each feature on a small piece of paper; fold it<br />
and place it in a container. Repeat, placing the folded<br />
papers into another container. Divide pupils into the same<br />
number of groups as features. A pupil from each group<br />
secretly picks one paper from each box. If the second<br />
location is the same as the first, re-draw. Keeping their<br />
locations secret, groups use direction language (north,<br />
south, east, west, left, right, straight ahead, forwards, back,<br />
above, below, in front of, behind) to describe a route from<br />
the first to the second location, mentioning other features<br />
that may also be seen. Groups read out their directions<br />
and the rest of the class tries to determine the starting<br />
point and destination. To make things easier, the starting<br />
point or the destination can be given.<br />
❂❂<br />
Repeat the previous activity using features on the street<br />
maps of local areas or national or international locations.<br />
A MAP LEGEND – PAGE 16<br />
❂❂<br />
List the major features around the school and its grounds<br />
that could be included in a large-scale map of the school.<br />
Categorise features as individual objects (point), locations<br />
that cover an area (area) or pathways (line). Discuss how<br />
each feature could be represented on the map. Create a<br />
class legend. Draw a mud map of the school, representing<br />
each feature as determined by the legend. Include the<br />
legend on the map. Reflect on the quality and accuracy of<br />
the map and suggest improvements.<br />
Review sample<br />
❂❂<br />
Look at a selection of map legends to determine if there<br />
is a standard way to represent common features. Draw a<br />
legend to show common features and the one or many<br />
ways each is represented.<br />
Prim-Ed Publishing – www.prim-ed.com vii 978-1-84654-917-5 <strong>Using</strong> <strong>Maps</strong><br />
BOOK 3
Teachers Notes<br />
READING A MAP – PAGES 17 AND 18<br />
MAP SCALES: TASMANIA – PAGES 23 AND 24<br />
❂❂<br />
Pupils look at a small section of an online large-scale<br />
map; e.g OS maps of Britain, IGN maps of other nations<br />
worldwide. Use the legend to give a detailed description<br />
of what the section is showing.<br />
❂❂<br />
Each pupil has a different section of an online large-scale<br />
map to study and describe. All pupils write questions<br />
about their section for others to answer. Pupils use the<br />
legend to help them answer the questions.<br />
❂❂<br />
Find and follow the course of a river or the route of a road<br />
or railway line on a large-scale map. Describe its journey<br />
past natural and constructed features.<br />
CREATING A MAP – PAGE 19<br />
❂❂<br />
Discuss and list natural and constructed features that<br />
could be located between two areas of population (cities,<br />
towns, villages). Draw a point or line, or shade an area, to<br />
represent each feature. Discuss and record the number<br />
and appropriate locations for each feature. Draw a light<br />
sketch of the map with all features in place. Discuss the<br />
map with a partner. What improvements could be made?<br />
Amend and colour the map. Include the legend.<br />
THE COMPASS ROSE – PAGE 20<br />
❂❂<br />
Look at online images for inspiration to draw a decorative,<br />
unique compass rose with the four cardinal directions:<br />
north, south, east and west, and the four ordinal directions:<br />
north-east, north-west, south-east and south-west. Use<br />
this rose as your signature on all maps you create in the<br />
future.<br />
❂❂<br />
Piece together and display pages of a local street directory<br />
with the school at the centre. Identify the direction in which<br />
each pupil’s house and popular community features lie in<br />
relation to the school.<br />
❂❂<br />
On a copy of a political world map, start from the city<br />
of your closest international airport and draw lines<br />
connecting the route you would take to visit the capital<br />
cities of countries you are interested in. From one city to<br />
the next, record which of the eight directions you would<br />
travel.<br />
MAP FEATURES: MADAGASCAR – PAGES 21 AND 22<br />
❂❂<br />
Draw a draft mud map, aligned to the north, of the setting<br />
from a well-known, popular story. <strong>Using</strong> evidence from<br />
the text, discuss approximate distances and directions<br />
from one location to another. Discuss and choose an<br />
appropriate, approximate scale for the map. Re-draw<br />
the map, amending distances between locations as<br />
necessary. Discuss an appropriate title for the map. Add<br />
the title, your signature compass rose, a legend and scale.<br />
❂❂<br />
Discuss the differences between small- and large-scale<br />
maps. Design a poster to explain the differences, referring<br />
to the size of the map, the area covered and number of<br />
features included.<br />
❂❂<br />
Discuss the scale of maps required for journeys of different<br />
distances: 10 km, 25 km, 50 km. Discuss and design a<br />
journey planning guide for each distance.<br />
LATITUDE AND LONGITUDE – PAGES 25 AND 26<br />
❂❂<br />
On the world map (page 26) shade in a square bound by<br />
any two pairs of lines of latitude and longitude. Shade in<br />
three more squares: two reflections of the first square, one<br />
across the equator, the other across the Prime meridian;<br />
the final square, a reflection of the second or third<br />
square across either the equator or the Prime meridian.<br />
What countries or oceans are included in each of the<br />
four squares? Compare and contrast information about<br />
the ‘contents’ of the four squares; e.g. climate, physical<br />
features.<br />
❂❂<br />
Examine the International Date Line, 180º on a globe or<br />
flat map. Compare and contrast it with the Prime meridian,<br />
0º. Explain any differences and how they might affect the<br />
people who live in the region.<br />
HEMISPHERES, TROPICS AND CIRCLES –<br />
PAGES 27 AND 28<br />
❂❂<br />
Use different maps to find information to make a booklet<br />
explaining the geographic areas bound by the main<br />
lines of latitude—the torrid region between the Tropics<br />
of Cancer and Capricorn; the temperate regions between<br />
the Tropic of Cancer and the Arctic Circle, and the Tropic of<br />
Capricorn and the Antarctic Circle; and the frigid regions<br />
between the Arctic Circle and the North Pole, and the<br />
Antarctic Circle and the South Pole.<br />
STORMY WEATHER – PAGES 29 AND 30<br />
❂❂<br />
Use different maps to find basic information about<br />
seasonal global winds (the north-east and south-east<br />
trade winds, the south-west and south-east monsoon<br />
winds, the northern and southern westerlies, and the<br />
Roaring Forties) and how they affect the weather. Show<br />
the information on a world map.<br />
Review sample<br />
❂❂<br />
Research the Doldrums and the Horse Latitudes including<br />
their effect on early explorations and how they got their<br />
names. Present all information on a map with a title and<br />
legend.<br />
❂❂<br />
Repeat the above activity looking at warm and cold ocean<br />
currents.<br />
❂❂<br />
Identify different symbols used on weather maps. Interpret<br />
a selection of online weather maps.<br />
<strong>Using</strong> <strong>Maps</strong> 978-1-84654-917-5 viii Prim-Ed Publishing – www.prim-ed.com<br />
BOOK 3
Teachers Notes<br />
DESCRIBING LOCATIONS – PAGE 31<br />
CONTINENT RESEARCH – PAGE 32<br />
❂❂<br />
Examine the numbered grid system of large-scale OS or<br />
IGN maps. Four-figure grid references identify the square<br />
where something is located. Six-figure grid references<br />
identify a more accurate ‘pin-point’ location. Design a<br />
poster to illustrate how four- and six-figure grid references<br />
are determined. Include references to ‘eastings’ and<br />
‘northings’.<br />
❂❂<br />
Devise a ‘Battleships’-type game in which six-figure grid<br />
references are used to hit an opponent’s target.<br />
❂❂<br />
Devise a quiz or card game, identifying the location of<br />
some major world cities using six-figure grid references.<br />
Section 2 (Year 6 and 6th Class)<br />
MAPS AND SCALES – PAGES 37 AND 38<br />
❂❂<br />
Make cards of different scales using each of the three ways<br />
scales are shown on maps. Place the cards randomly, face<br />
down on a table. Pupils play ‘Concentration’, picking up<br />
three cards at a time, trying to find a set of three showing<br />
the same scale.<br />
❂❂<br />
Lay out some easy-to-measure objects on the desk. On<br />
a piece of plain A4 paper, draw a draft sketch of the<br />
setting. Measure the length and breadth of the desk<br />
and each object, and mark the measurements on the<br />
sketch. Consider the different lengths and decide on an<br />
appropriate scale to use. Next to each measurement on<br />
the sketch, record the scaled down measurement. On a<br />
second piece of plain A4 paper, draw the desk map to<br />
scale. Repeat using different scales on ever-decreasing<br />
paper sizes. What is the smallest scaled map pupils can<br />
make?<br />
❂❂<br />
Make a number of different scale maps, using the three<br />
ways to show scale, of the classroom or other familiar<br />
inside area of the school. Include places of interest,<br />
marking each with a point from which the distance to<br />
another location can be found. Share the maps among<br />
the pupils, asking them to use the scales given to calculate<br />
the real distances between features. When all maps have<br />
been completed, reveal the real distances. How accurate<br />
were the pupils’ measurements and calculations?<br />
Development Activities<br />
❂❂<br />
<strong>Using</strong> maps, investigate how the political divisions of a<br />
continent have changed over time; e.g. the rise and fall of<br />
ancient empires and cultures, the change in boundaries<br />
with colonisation and after wars. Show information on a<br />
world map.<br />
❂❂<br />
Look at maps to compare the major physical features<br />
found across continents. Show information on a world<br />
map.<br />
❂❂<br />
Study maps to investigate main areas of population<br />
across each continent. Show information on a world map.<br />
USING SCALE AND DIRECTION – PAGES 39 AND 40<br />
❂❂<br />
Create a correctly oriented map of the school grounds.<br />
Use a ruler and protractor to accurately draw an eightpoint<br />
compass rose on a large piece of robust card.<br />
Stand in a central area of the school grounds and use a<br />
compass to determine which direction is north. Secure the<br />
card to a flat surface, aligning the arrow to the north. Use a<br />
variety of tools (trundle wheel, tape measure, metre sticks)<br />
to measure the extent of the school grounds in each<br />
direction. Determine the scale required to draw a scaled<br />
map of the school on a large piece of paper. Discuss<br />
the features to add to the map and how to categorise<br />
them. Use appropriate measuring tools to measure the<br />
length and breadth of buildings. Draw them to scale on<br />
coloured card according to their category. Cut them out<br />
and place on card in the correct orientation. When certain<br />
of each feature’s location, glue the card onto the base<br />
paper. Determine representations for other features to be<br />
included on the map. Draw them to scale, cut them out<br />
and place each on the map in the correct location. Add a<br />
compass rose to the map.<br />
❂❂<br />
Recreate the map from the above activity using different<br />
scales.<br />
Review sample<br />
DRAWING A MAP TO SCALE – PAGES 41 AND 42<br />
❂❂<br />
Choose an area of garden or park to map. Measure its<br />
perimeter. Determine an appropriate scale for drawing the<br />
map on an A3 piece of 1-cm 2 paper. Draw the outline of<br />
the garden or park map on the squared paper. Measure<br />
all the features to be included in the map. Convert them<br />
to scale. Take different measurements from one feature to<br />
another to determine the exact location of each feature<br />
on the map.<br />
Prim-Ed Publishing – www.prim-ed.com ix 978-1-84654-917-5 <strong>Using</strong> <strong>Maps</strong><br />
BOOK 3
Teachers Notes<br />
DRAWING TO SCALE: ENLARGING AND REDUCING –<br />
PAGES 43 AND 44<br />
❂❂<br />
Secure a small-squared acetate grid over a simple line<br />
drawing of an object or representation. <strong>Using</strong> squared<br />
paper of increasingly larger squares than those on the<br />
acetate sheet, copy the line drawing square by square<br />
to create larger images. Compare the size of the squares<br />
to determine how much larger each image is than the<br />
original. Display images in order of size.<br />
❂❂<br />
Repeat the activity using a large-squared acetate grid over<br />
the image to be copied and smaller-squared paper.<br />
CARTESIAN COORDINATE SYSTEM: ONE AND FOUR<br />
QUADRANTS – PAGES 45 AND 46<br />
❂❂<br />
Fix a one or four quadrant small-squared acetate grid over<br />
standard maps to identify the location of different features.<br />
❂❂<br />
Trace the outline of any country on to an A4 piece of<br />
1-cm 2 squared paper. Where the outline passes through<br />
the intersection of lines, mark a point. Choosing either one<br />
or four quadrants, mark and label the x and y axes on the<br />
paper. Record the coordinates for each point on the paper<br />
and also as a list on a separate page. Redistribute the lists<br />
among pupils for them to follow the coordinates and draw<br />
the country outlines.<br />
CARTESIAN PLANE – PAGES 47 TO 50<br />
❂❂<br />
Prepare a scaled plan of the classroom on 1-cm 2 paper.<br />
Ensure that the desk of each pupil sits at the intersection of<br />
lines. Add a one or four Cartesian grid to the plan. Present<br />
the plan on the whiteboard or give pupils individual<br />
copies. Identify pupils by the coordinates of their desks<br />
and instruct them to change places.<br />
PHYSICAL FEATURES – PAGES 51 TO 54<br />
❂❂<br />
Locate your home town on a physical map of your country.<br />
Describe your country and your town’s location within it<br />
by its natural features. <strong>Using</strong> a large-scale physical map,<br />
describe your local area and your home’s location within<br />
it by its natural features.<br />
❂❂<br />
Describe how the climate and weather of your home town<br />
is affected by its proximity to natural features.<br />
❂❂<br />
Identify and interpret how relief is represented on<br />
different maps. Create a booklet of simple diagrams and<br />
explanations for the use of contour lines and shades of<br />
the same colour.<br />
❂❂<br />
Study physical and political maps of different continents<br />
to compare physical features among countries. Present all<br />
information on a map with a title and legend.<br />
WORLD TEMPERATURES – PAGES 55 AND 56<br />
❂❂<br />
Research world records for extreme weather. Present all<br />
information on a map with a title and legend.<br />
❂❂<br />
From maps of world average temperatures, copy the<br />
colours of a legend that show annual temperatures, at<br />
10 ºC intervals, from less than –30 ºC to greater than<br />
30 ºC. Research to find the monthly temperature figures<br />
for your capital city or another place of interest. Use the<br />
legend to illustrate the information.<br />
❂❂<br />
Examine different weather maps (synoptic charts). Draw<br />
and colour the different lines and symbols used on the<br />
maps. Research to identify their meaning. Create a<br />
legend of simple diagrams and explanations to show the<br />
information. Draw a synoptic map and use the legend to<br />
describe the current weather.<br />
WORLD TIME ZONES – PAGES 57 AND 58<br />
❂❂<br />
On individual cards, write the names of world capital<br />
cities. Randomly choose two cards and compare their<br />
time zones with each other, with Greenwich and with local<br />
time.<br />
❂❂<br />
Determine which countries within a continent or counties/<br />
states within a country alter their times for the summer<br />
half of the year, from spring to autumn? Present all<br />
information on a map.<br />
❂❂<br />
Use paper plates to make simple clock faces. Write the<br />
names of a selection of countries from each continent,<br />
including your own, on individual pieces of card. At any<br />
time of the day, randomly select some countries (but<br />
always your own) and determine what time of the day it is<br />
there. Attach the country name to a clock face and move<br />
the hands to show the correct time. Place each clock<br />
face in chronological order to show the times in different<br />
countries relative to your own.<br />
COUNTRY POPULATION AND DENSITY –<br />
PAGES 59 AND 60<br />
❂❂<br />
Find a world population density map showing areas<br />
of low, medium and high density. Write a report on the<br />
information the map provides.<br />
❂❂<br />
Look at a map of population distribution of an individual<br />
country. Compare it with a map of physical features and<br />
a map of natural resources. Discuss and record any links<br />
you find.<br />
Review sample<br />
<strong>Using</strong> <strong>Maps</strong> 978-1-84654-917-5 x Prim-Ed Publishing – www.prim-ed.com<br />
BOOK 3
Teachers Notes<br />
WORLD AGRICULTURE AND RESOURCES –<br />
PAGES 61 AND 62<br />
AUSTRALIAN POPULATION AND CULTURAL DIVERSITY –<br />
PAGES 67 AND 68<br />
❂❂<br />
Research the location of major tea, coffee and sugar<br />
plantations. What does the location suggest about the<br />
best climate for each?<br />
❂❂<br />
Research the world’s top ten countries for the greatest<br />
number of natural resources. Present all information on a<br />
map with a title and legend.<br />
❂❂<br />
Choose a selection of natural resources, farmed produce<br />
or manufactured products and find the top ten producers<br />
of each one. Present all information on a map with a title<br />
and legend.<br />
WORLD MARKETS – PAGES 63 AND 64<br />
❂❂<br />
Make lists of different categories of items you have at<br />
home; e.g. food, clothing, furniture, white goods, electronic<br />
goods. Where were they made? Present all information on<br />
a map with a title and legend.<br />
❂❂<br />
For each category of items found at home, investigate the<br />
top five exporters. Present all information on a map with a<br />
title and legend.<br />
❂❂<br />
Investigate a possible link between countries that are<br />
major exporters in manufactured goods and the countries’<br />
area and physical features. Record and share information.<br />
WORLD POLLUTION – PAGES 65 AND 66<br />
❂❂<br />
Compare world maps of countries’ carbon dioxide<br />
emissions and of developed and developing nations.<br />
Investigate a possible link between pollution and the level<br />
of development of a nation. Record and share information.<br />
❂❂<br />
Investigate the location of the Great Pacific Garbage<br />
Patch and how the local currents help to maintain it there.<br />
Present all information on a map with a title and legend.<br />
❂❂<br />
Find data in units of pollution for the top ten most polluted<br />
cities. Create a shades of colour (choropleth) legend<br />
showing: less than 50, 50–100, 100–150, 150–200 and<br />
over 250 units of pollution. List the cities in a table against<br />
the correct shade of colour. Locate each city on the map<br />
encircled in the appropriate shade of colour.<br />
❂❂<br />
Research areas/countries across different continents that<br />
have been colonised/invaded/occupied by other nations/<br />
empires in different time periods, from the ancient times<br />
to the modern era. Present all information on a map with<br />
a title and legend.<br />
Review sample<br />
Prim-Ed Publishing – www.prim-ed.com xi 978-1-84654-917-5 <strong>Using</strong> <strong>Maps</strong><br />
BOOK 3
Teachers Resource – <strong>Book</strong> 3<br />
Blank Grid<br />
Review sample<br />
<strong>Using</strong> <strong>Maps</strong> 978-1-84654-917-5 xii Prim-Ed Publishing – www.prim-ed.com<br />
BOOK 3
Teachers Resource – <strong>Book</strong> 3<br />
Cartesian Plane – One Quadrant<br />
23<br />
22<br />
21<br />
20<br />
19<br />
18<br />
17<br />
16<br />
15<br />
14<br />
13<br />
12<br />
11<br />
10<br />
9<br />
8<br />
7<br />
6<br />
5<br />
4<br />
Review sample<br />
3<br />
2<br />
1<br />
0<br />
0 1 2 3 4 5 6 7 8 9 10 11 12 13 14 15 16<br />
Prim-Ed Publishing – www.prim-ed.com xiii 978-1-84654-917-5 <strong>Using</strong> <strong>Maps</strong><br />
BOOK 3
Teachers Resource – <strong>Book</strong> 3<br />
14<br />
Cartesian Plane – Four Quadrants<br />
13<br />
12<br />
11<br />
10<br />
9<br />
8<br />
7<br />
6<br />
5<br />
4<br />
3<br />
2<br />
1<br />
10 –9 –8 –7 –6 –5 –4 –3 –2 –1 –1<br />
–2<br />
–3<br />
–4<br />
–5<br />
–6<br />
–7<br />
–8<br />
–9<br />
–10<br />
–11<br />
–12<br />
–13<br />
1 2 3 4 5 6 7 8 9 10<br />
<strong>Using</strong> <strong>Maps</strong> 978-1-84654-917-5 xiv Prim-Ed Publishing – www.prim-ed.com<br />
BOOK 3<br />
Review sample<br />
–14
Map of United Kingdom and Republic of Ireland<br />
Teachers Resource – <strong>Book</strong> 3<br />
Atlantic Ocean<br />
Beenkeragh<br />
Cork<br />
Limerick<br />
River Bann<br />
Ben Nevis<br />
Irish Sea<br />
Glasgow<br />
Snowden<br />
North Sea<br />
Leeds<br />
Manchester<br />
River Severn<br />
Birmingham<br />
Review sample<br />
River Tha m es<br />
The English Channel<br />
Prim-Ed Publishing – www.prim-ed.com xv 978-1-84654-917-5 <strong>Using</strong> <strong>Maps</strong><br />
BOOK 3
Teachers Resource – <strong>Book</strong> 3<br />
Map of Asia<br />
75° 75°<br />
66° Arctic Circle<br />
60°<br />
45°<br />
30°<br />
23.5° Tropic of Cancer<br />
15°<br />
Arctic Circle 66°<br />
60°<br />
45°<br />
30°<br />
Tropic of Cancer 23.5°<br />
15°<br />
0° Equator<br />
Equator 0°<br />
0°<br />
10° E<br />
20° E<br />
30° E<br />
40° E<br />
50° E<br />
60° E<br />
70° E<br />
80° E<br />
90° E<br />
100° E<br />
110° E<br />
120° E<br />
130° E<br />
140° E<br />
150° E<br />
160° E<br />
170° E<br />
180°<br />
170° W<br />
0°<br />
10° E<br />
20° E<br />
30° E<br />
40° E<br />
50° E<br />
60° E<br />
70° E<br />
80° E<br />
90° E<br />
100° E<br />
110° E<br />
120° E<br />
130° E<br />
140° E<br />
150° E<br />
160° E<br />
170° E<br />
180°<br />
170° W<br />
Review sample<br />
<strong>Using</strong> <strong>Maps</strong> 978-1-84654-917-5 xvi Prim-Ed Publishing – www.prim-ed.com<br />
BOOK 3
Australia and her Neighbours<br />
Teachers Resource – <strong>Book</strong> 3<br />
Review sample<br />
Prim-Ed Publishing – www.prim-ed.com xvii 978-1-84654-917-5 <strong>Using</strong> <strong>Maps</strong><br />
BOOK 3
Ural Mountains<br />
70° N<br />
Arctic Circle<br />
60° N<br />
50° N<br />
40° N<br />
Map of Europe<br />
see originals<br />
Teachers Resource – <strong>Book</strong> 3<br />
20° W<br />
20° W<br />
0°<br />
20° E<br />
40° E<br />
0°<br />
20° E<br />
40° E<br />
60° E<br />
60° E<br />
70° N<br />
Arctic Circle<br />
60° N<br />
50° N<br />
40° N<br />
Review sample<br />
<strong>Using</strong> <strong>Maps</strong> 978-1-84654-917-5 xviii Prim-Ed Publishing – www.prim-ed.com<br />
BOOK 3
Teachers Resource – <strong>Book</strong> 3<br />
Map of North America<br />
50º N<br />
40º N<br />
30º N<br />
20º N<br />
0º<br />
60º N 70º N 80º N 80º N 70º N 60º N<br />
Review sample<br />
50º N<br />
40º N<br />
30º N<br />
20º N<br />
0º<br />
130º W<br />
120º W<br />
110º W<br />
100º W<br />
90º W<br />
80º W<br />
70º W<br />
Prim-Ed Publishing – www.prim-ed.com xix 978-1-84654-917-5 <strong>Using</strong> <strong>Maps</strong><br />
BOOK 3
Teachers Resource – <strong>Book</strong> 3<br />
Map of South America<br />
10° N<br />
100° 80W 90° 70W 80° 60W 70° 50W 60° 40 W<br />
0°<br />
10° S<br />
20° S<br />
30° S<br />
40° S<br />
50° S<br />
Review sample<br />
10<br />
10° N<br />
0°<br />
10° S<br />
20° S<br />
30° S<br />
40° S<br />
50° S<br />
110° W 100° W 90° W 80° W 70° W 60° W 50° W<br />
<strong>Using</strong> <strong>Maps</strong> 978-1-84654-917-5 xx Prim-Ed Publishing – www.prim-ed.com<br />
BOOK 3
Teachers Resource – <strong>Book</strong> 3<br />
Map of Africa<br />
20° W 10° W 0° 10° E 20° E 30° E 40° E 50° E 60° E<br />
30° N<br />
30° N<br />
20° N<br />
10° N<br />
0°<br />
10° S<br />
20° S<br />
30° S<br />
Review sample<br />
20° W<br />
10° W<br />
0°<br />
10° E<br />
20° E<br />
30° E<br />
40° E<br />
50° E<br />
20° N<br />
10° N<br />
0°<br />
10° S<br />
20° S<br />
30° S<br />
Prim-Ed Publishing – www.prim-ed.com xxi 978-1-84654-917-5 <strong>Using</strong> <strong>Maps</strong><br />
BOOK 3
Teachers Resource – <strong>Book</strong> 3<br />
Glossary<br />
aerial view<br />
Antarctic Circle<br />
Arctic Circle<br />
atlas<br />
cardinal directions<br />
Cartesian coordinate<br />
system<br />
cartographer<br />
compass rose<br />
continent<br />
coordinates<br />
cyclone<br />
direction<br />
distance<br />
economic (or<br />
resource) map<br />
equator<br />
frigid zone<br />
grid reference<br />
system<br />
hemisphere<br />
horizontal view<br />
hurricane<br />
International Date<br />
Line<br />
legend<br />
line scale<br />
lines of latitude<br />
lines of longitude<br />
location<br />
managed features<br />
a view of a place or object from high above, either directly or at an angle<br />
the line of latitude at approximately 66º south of the Equator<br />
the line of latitude at approximately 66º north of the Equator<br />
a book using maps to illustrate information relating to the world and human influences upon it<br />
north, south, east, west<br />
a grid of numbered horizontal and vertical lines allowing location to be determined by<br />
coordinates<br />
a person who draws maps<br />
a diagram on a map showing in which direction north lies<br />
one of the world’s seven main continuous expanses of land<br />
a set of numbers representing the horizontal and vertical lines of a Cartesian grid<br />
tropical storm developing over the Indian Ocean and the South Pacific Ocean typically between<br />
November and April<br />
the location of one feature relative to another, or the course along which something moves or<br />
extends<br />
the measured space between locations<br />
showing information about what a country produces or grows, using symbols or colours<br />
the line of latitude at 0º that divides the globe into the northern and southern hemispheres<br />
the areas of the globe between the Arctic Circle and the North Pole in the northern hemisphere<br />
and the Antarctic Circle and the South Pole in the southern hemisphere<br />
a labelled grid of horizontal and vertical lines allowing location within an area to be determined<br />
by a pair of letter/number coordinates<br />
half of Earth, divided into northern and southern hemispheres (halves) by the equator<br />
from eye level<br />
tropical storm developing over the Atlantic and north-east Pacific oceans typically between<br />
June and November each year<br />
the line of longitude at 180º east and west of the Prime meridian; places immediately to its<br />
west are 24 hours ahead of places immediately to its east<br />
Review sample<br />
the key to unlocking the information represented on a map; using point, line or area<br />
representations<br />
a linear diagram showing the link between distance on the ground and distance on the map<br />
the parallel horizontal lines running across the globe, decreasing in diameter from the equator<br />
to the North Pole and the equator to the South Pole<br />
the vertical lines running from pole to pole, the distance between them expanding between<br />
each pole and the equator where the distance is at its greatest; all lines bisect the globe into<br />
hemispheres<br />
the exact place, identifiable by coordinates, where a feature exists (absolute) or the place,<br />
identifiable by direction, where one feature exists in relation to another (relative)<br />
features on a map that may appear natural but require maintenance; e.g. parks and gardens<br />
<strong>Using</strong> <strong>Maps</strong> 978-1-84654-917-5 xxii Prim-Ed Publishing – www.prim-ed.com<br />
BOOK 3
map<br />
mud map<br />
natural features<br />
North Pole<br />
oblique view<br />
ordinal directions<br />
physical map<br />
political map<br />
pollution index<br />
population density<br />
position<br />
Prime meridian<br />
quadrant<br />
ratio scale<br />
satellite image<br />
scale<br />
South Pole<br />
street furniture<br />
street map<br />
symbol<br />
temperate zone<br />
thematic map<br />
time zone<br />
Tropic of Cancer<br />
Tropic of Capricorn<br />
tropics (torrid zone)<br />
typhoon<br />
vertical view<br />
a visual representation of information: of a space and its features or of data<br />
to show relative position and direction of a destination from a starting point, highlighting<br />
specific features to note; not to scale<br />
features on a map that exist without interference from humans<br />
the northernmost point of Earth where the planet’s axis intersects with its surface at line of<br />
latitude at 90º north of the equator; the sun rises above the horizon once a year at the March<br />
equinox and sets once per year at the September equinox<br />
as see from above, at an angle<br />
north-east, north-west, south-east, south-west<br />
showing natural features and land forms<br />
showing local, national and international borders<br />
a number used by governments to communicate how polluted the air is<br />
a measurement of population per unit area<br />
see location<br />
the line of longitude at 0º, passing through the Royal Observatory at Greenwich, London<br />
one of four possible sections made by the intersection of one x axis perpendicular (at right<br />
angles) to one y axis<br />
a ratio showing how many units of length on the ground are represented by one unit of length<br />
on the map; e.g. 1:100 000 could mean 1 cm on the map represents 100 000 cm (or 1 km)<br />
on the ground<br />
photograph taken from high above capable of showing vertical view<br />
ratio of distance and size between the map and the area it is representing<br />
the southernmost point of Earth where the planet’s axis intersects with its surface at line<br />
of latitude at 90º south of the equator; the sun rises above the horizon once a year at the<br />
September equinox and sets once per year at the March equinox<br />
constructed features on a map that form part of a community’s infrastructure; e.g. telegraph<br />
poles, letterboxes, bus stops, park benches<br />
showing road systems and land use within populated areas<br />
a mark or character used as a representation of an object or place<br />
the areas of the globe between the Tropic of Cancer and the Arctic Circle in the northern<br />
hemisphere and the Tropic of Capricorn and the Antarctic Circle in the southern hemisphere<br />
giving information about a specific subject; e.g. climate, vegetation<br />
a geographical division of the globe allowing for a standardised calculation of time relative to<br />
Greenwich; from Greenwich east to the International Date Line, places are ‘ahead’ in time; west<br />
of Greenwich to the date line, places are ‘behind’ in time<br />
the line of latitude at approximately 23º north of the equator<br />
the line of latitude at approximately 23º south of the equator<br />
the area of the globe on either side of the equator, extending north to the Tropic of Cancer and<br />
south to the Tropic of Capricorn<br />
tropical storm developing over the north-west Pacific Ocean typically between May and October<br />
from directly above<br />
Teachers Resource – <strong>Book</strong> 3<br />
Review sample<br />
written scale a statement describing the representation of distance on the map compared with distance on<br />
the ground; e.g. 1 cm represents 10 km<br />
Prim-Ed Publishing – www.prim-ed.com xxiii 978-1-84654-917-5 <strong>Using</strong> <strong>Maps</strong><br />
BOOK 3
Teachers Resource – <strong>Book</strong> 3<br />
Scope and<br />
Sequence Chart –<br />
Section 1 – Year 5<br />
(England)<br />
NATIONAL CURRICULUM FOR ENGLAND – GEOGRAPHY – KEY STAGE 2<br />
LOCATIONAL KNOWLEDGE HUMAN AND PHYSICAL GEOGRAPHY GEOGRAPHICAL SKILLS AND FIELDWORK<br />
Locate the world’s<br />
countries, using maps<br />
to focus on Europe and<br />
North and South America,<br />
concentrating on their<br />
environmental regions,<br />
key physical and human<br />
characteristics, countries<br />
and major cities.<br />
Identify the position and<br />
significance of latitude,<br />
longitude, Equator,<br />
Northern Hemisphere,<br />
Southern Hemisphere,<br />
the Tropics of Cancer<br />
and Capricorn, Arctic and<br />
Antarctic Circle, the Prime/<br />
Greenwich Meridian and<br />
time zones.<br />
Describe and understand<br />
key aspects of physical<br />
geography, including:<br />
climate zones, biomes and<br />
vegetation belts, rivers,<br />
mountains, volcanoes and<br />
earthquakes and the water<br />
cycle.<br />
Describe and understand<br />
key aspect of human<br />
geography, including: types<br />
of settlement and land<br />
use, economic activity<br />
including trade links and<br />
the distribution of natural<br />
resources including energy,<br />
food, minerals and water.<br />
Use maps, atlases, globes<br />
and digital/computer<br />
mapping to locate<br />
countries and describe<br />
features studied.<br />
Use the eight points of<br />
a compass, four and<br />
six-figure grid references,<br />
symbols and keys to build<br />
their knowledge of the<br />
United Kingdom and the<br />
wider world.<br />
Use fieldwork to observe,<br />
measure, record and<br />
present the human and<br />
physical features in the<br />
local area using a range of<br />
methods, including sketch<br />
maps, plans and graphs<br />
and digital technologies.<br />
PAGE TITLE<br />
1–2 Different Views ✔<br />
3–4 Identifying <strong>Maps</strong> ✔<br />
5 Choosing <strong>Maps</strong> ✔<br />
7 <strong>Using</strong> an Atlas ✔ ✔<br />
7–8 Grid <strong>Maps</strong>: a Zoo ✔ ✔<br />
9–10 Grid <strong>Maps</strong>: a School ✔ ✔<br />
11–12 Grid <strong>Maps</strong>: a Classroom ✔ ✔<br />
13–14 Street <strong>Maps</strong> ✔ ✔<br />
15 Directional Language ✔ ✔<br />
Review sample<br />
16 A Map Legend ✔<br />
17–18 Reading a Map ✔ ✔<br />
19 Creating a Map ✔<br />
20 The Compass Rose ✔<br />
21–22 Map Features: Madagascar ✔ ✔ ✔<br />
23–24 Map Scales: Tasmania ✔ ✔<br />
25–26 Latitude And Longitude ✔ ✔ ✔<br />
27–28 Hemispheres, Tropics and Circles ✔ ✔ ✔ ✔<br />
29–30 Stormy Weather ✔ ✔<br />
31 Describing Locations ✔ ✔ ✔<br />
32 Continent Research ✔ ✔ ✔ ✔ ✔<br />
33–36 Assessment Activities ✔ ✔ ✔ ✔ ✔<br />
<strong>Using</strong> <strong>Maps</strong> 978-1-84654-917-5 xxiv Prim-Ed Publishing – www.prim-ed.com<br />
BOOK 3
Teachers Resource – <strong>Book</strong> 3<br />
Scope and<br />
Sequence Chart –<br />
Section 2 – Year 6<br />
(England)<br />
NATIONAL CURRICULUM FOR ENGLAND – GEOGRAPHY – KEY STAGE 2<br />
LOCATIONAL KNOWLEDGE HUMAN AND PHYSICAL GEOGRAPHY GEOGRAPHICAL SKILLS AND FIELDWORK<br />
Locate the world’s countries,<br />
using maps to focus on<br />
Europe and North and South<br />
America, concentrating on<br />
their environmental regions,<br />
key physical and human<br />
characteristics, countries<br />
and major cities.<br />
Identify the position and<br />
significance of latitude,<br />
longitude, Equator, Northern<br />
Hemisphere, Southern<br />
Hemisphere, the Tropics of<br />
Cancer and Capricorn, Arctic<br />
and Antarctic Circle, the<br />
Prime/Greenwich Meridian<br />
and time zones.<br />
Describe and understand<br />
key aspects of physical<br />
geography, including:<br />
climate zones, biomes and<br />
vegetation belts, rivers,<br />
mountains, volcanoes and<br />
earthquakes and the water<br />
cycle.<br />
Describe and understand<br />
key aspect of human<br />
geography, including: types<br />
of settlement and land<br />
use, economic activity<br />
including trade links and<br />
the distribution of natural<br />
resources including energy,<br />
food, minerals and water.<br />
Use maps, atlases, globes<br />
and digital/computer<br />
mapping to locate countries<br />
and describe features<br />
studied.<br />
Use the eight points of a<br />
compass, four and six-figure<br />
grid references, symbols<br />
and keys to build their<br />
knowledge of the United<br />
Kingdom and the wider<br />
world.<br />
Use fieldwork to observe,<br />
measure, record and<br />
present the human and<br />
physical features in the<br />
local area using a range of<br />
methods, including sketch<br />
maps, plans and graphs and<br />
digital technologies.<br />
PAGE TITLE<br />
37–38 <strong>Maps</strong> and scales ✔ ✔<br />
39–40 <strong>Using</strong> scale and direction ✔ ✔<br />
41–42 Drawing a map to scale ✔<br />
43 Drawing to scale – enlarging ✔<br />
44 Drawing to scale – reducing ✔<br />
45<br />
46<br />
Cartesian coordinate system –<br />
one quadrant<br />
Cartesian coordinate system –<br />
four quadrants<br />
47–48 Cartesian plane: Island map ✔ ✔<br />
49–50 Cartesian plane: Map of Victoria ✔ ✔ ✔ ✔ ✔<br />
51–52 Physical features: Asia ✔ ✔ ✔ ✔ ✔<br />
53–54 Physical features: Europe ✔ ✔ ✔ ✔<br />
55–56 World temperatures ✔ ✔ ✔ ✔ ✔<br />
57–58 World time zones ✔ ✔ ✔<br />
59–60 Country population and density ✔ ✔ ✔ ✔ ✔<br />
✔<br />
✔<br />
Review sample<br />
61–62 World agriculture and resources ✔ ✔ ✔ ✔ ✔<br />
63–64 World markets ✔ ✔ ✔ ✔ ✔<br />
65–66 World pollution index ✔ ✔ ✔ ✔<br />
67–68<br />
Australian population and cultural<br />
diversity<br />
✔ ✔ ✔ ✔<br />
69–72 Assessment Activities ✔ ✔ ✔ ✔ ✔ ✔<br />
Prim-Ed Publishing – www.prim-ed.com xxv 978-1-84654-917-5 <strong>Using</strong> <strong>Maps</strong><br />
BOOK 3
Teachers Resource – <strong>Book</strong> 3<br />
Scope and<br />
Sequence Chart –<br />
Section 1 – 5th<br />
Class (Republic<br />
of Ireland)<br />
A SENSE OF<br />
PLACE<br />
CURRICULUM FOR REPUBLIC OF IRELAND – GEOGRAPHY – 5th/6th CLASSES<br />
A SENSE OF SPACE USING PICTURES, MAPS AND GLOBES MAPS AND GLOBES<br />
PHYSICAL FEATURES OF<br />
EUROPE AND THE WORLD<br />
WEATHER,<br />
CLIMATE AND<br />
ATMOSPHERE<br />
ENVIRONMENTAL<br />
AWARENESS<br />
Become familiar with the distinctive<br />
natural and human features of<br />
some places in Europe and other<br />
parts of the world.<br />
Begin to develop an understanding<br />
of the names and relative location<br />
of some natural and human<br />
features of Europe and the world.<br />
Estimate and measure distances<br />
and establish cardinal directions<br />
during exploration of the locality.<br />
Develop some awareness of<br />
directions in wider environments.<br />
Use and record directions and<br />
routes on maps.<br />
Develop familiarity with, and<br />
engage in practical use of, maps<br />
and photographs of a variety of<br />
scales and purposes.<br />
Develop an understanding of and<br />
use common map features and<br />
conventions.<br />
Use maps to record routes and<br />
directions in the locality and wider<br />
environments.<br />
Construct some simple maps and<br />
models of natural and human<br />
features in the local environment.<br />
Compare maps, globes, aerial<br />
photographs, satellite photographs<br />
and other remotely sensed images.<br />
Recognise key lines of latitude and<br />
longitude on the globe.<br />
Learn about a small number of the<br />
major natural features of Europe.<br />
Become familiar with the names<br />
and approximate location of a<br />
small number of major world<br />
physical features.<br />
Become aware of the<br />
characteristics of some major<br />
climatic regions in different parts<br />
of the world.<br />
Foster an appreciation of the ways<br />
in which people use the Earth’s<br />
resources.<br />
PAGE TITLE<br />
1–2 Different Views ✔<br />
3–4 Identifying <strong>Maps</strong> ✔ ✔ ✔<br />
5 Choosing <strong>Maps</strong> ✔ ✔ ✔<br />
7 <strong>Using</strong> an Atlas ✔<br />
7–8 Grid <strong>Maps</strong>: a Zoo ✔ ✔<br />
9–10 Grid <strong>Maps</strong>: a School ✔ ✔ ✔ ✔<br />
11–12 Grid <strong>Maps</strong>: a Classroom ✔ ✔<br />
13–14 Street <strong>Maps</strong> ✔ ✔<br />
Review sample<br />
15 Directional Language ✔ ✔<br />
16 A Map Legend ✔<br />
17–18 Reading a Map ✔ ✔ ✔<br />
19 Creating a Map ✔ ✔<br />
20 The Compass Rose ✔ ✔<br />
21–22 Map Features: Madagascar ✔ ✔ ✔ ✔ ✔ ✔<br />
23–24 Map Scales: Tasmania ✔ ✔ ✔ ✔ ✔<br />
25–26 Latitude And Longitude ✔ ✔ ✔ ✔ ✔<br />
27–28 Hemispheres, Tropics and Circles ✔ ✔ ✔ ✔ ✔<br />
29–30 Stormy Weather ✔ ✔<br />
31 Describing Locations ✔ ✔ ✔ ✔<br />
32 Continent Research ✔ ✔<br />
33–36 Assessment Activities ✔ ✔ ✔ ✔ ✔ ✔ ✔ ✔ ✔ ✔ ✔<br />
<strong>Using</strong> <strong>Maps</strong> 978-1-84654-917-5 xxvi Prim-Ed Publishing – www.prim-ed.com<br />
BOOK 3
Teachers Resource – <strong>Book</strong> 3<br />
Scope and<br />
Sequence Chart –<br />
Section 2 – 6th<br />
Class (Republic<br />
of Ireland)<br />
A SENSE OF<br />
PLACE<br />
CURRICULUM FOR REPUBLIC OF IRELAND – GEOGRAPHY – 5th/6th CLASSES<br />
A SENSE OF SPACE USING PICTURES, MAPS AND GLOBES MAPS AND GLOBES<br />
PHYSICAL FEATURES OF<br />
EUROPE AND THE WORLD<br />
WEATHER,<br />
CLIMATE AND<br />
ATMOSPHERE<br />
ENVIRONMENTAL<br />
AWARENESS<br />
Become familiar with the distinctive<br />
natural and human features of<br />
some places in Europe and other<br />
parts of the world.<br />
Begin to develop an understanding<br />
of the names and relative location<br />
of some natural and human<br />
features of Europe and the world.<br />
Estimate and measure distances<br />
and establish cardinal directions<br />
during exploration of the locality.<br />
Develop some awareness of<br />
directions in wider environments.<br />
Use and record directions and<br />
routes on maps.<br />
Develop familiarity with, and<br />
engage in practical use of, maps<br />
and photographs of a variety of<br />
scales and purposes.<br />
Develop an understanding of and<br />
use common map features and<br />
conventions.<br />
Use maps to record routes and<br />
directions in the locality and wider<br />
environments.<br />
Construct some simple maps and<br />
models of natural and human<br />
features in the local environment.<br />
Compare maps, globes, aerial<br />
photographs, satellite photographs<br />
and other remotely sensed images.<br />
Recognise key lines of latitude and<br />
longitude on the globe.<br />
Learn about a small number of the<br />
major natural features of Europe.<br />
Become familiar with the names<br />
and approximate location of a<br />
small number of major world<br />
physical features.<br />
Become aware of the<br />
characteristics of some major<br />
climatic regions in different parts<br />
of the world.<br />
Foster an appreciation of the ways<br />
in which people use the Earth’s<br />
resources.<br />
PAGE TITLE<br />
37–38 <strong>Maps</strong> and Scales ✔ ✔ ✔ ✔ ✔<br />
39–40 <strong>Using</strong> Scale and Direction ✔ ✔ ✔<br />
41–42 Drawing a Map to Scale ✔<br />
43 Drawing to Scale – Enlarging ✔ ✔ ✔<br />
44 Drawing to Scale – Reducing ✔ ✔ ✔<br />
45<br />
46<br />
Cartesian Coordinate System –<br />
One Quadrant<br />
Cartesian Coordinate System –<br />
Four Quadrants<br />
47–48 Cartesian Plane: Island Map ✔ ✔ ✔ ✔<br />
49–50 Cartesian Plane: Map of Victoria ✔ ✔ ✔ ✔ ✔<br />
51–52 Physical Features: Asia ✔ ✔ ✔ ✔ ✔ ✔<br />
53–54 Physical Features: Europe ✔ ✔ ✔ ✔ ✔<br />
55–56 World Temperatures ✔ ✔ ✔ ✔ ✔<br />
57–58 World Time Zones ✔ ✔ ✔<br />
59–60 Country Population and Density ✔ ✔ ✔ ✔<br />
✔<br />
Review sample<br />
✔<br />
61–62 World Agriculture and Resources ✔ ✔ ✔<br />
63–64 World Markets ✔ ✔<br />
65–66 World Pollution Index ✔<br />
67–68<br />
Australian Population and Cultural<br />
Diversity<br />
✔ ✔ ✔ ✔ ✔<br />
69–72 Assessment Activities ✔ ✔ ✔ ✔ ✔ ✔ ✔ ✔<br />
Prim-Ed Publishing – www.prim-ed.com xxvii 978-1-84654-917-5 <strong>Using</strong> <strong>Maps</strong><br />
BOOK 3
Teachers Resource – Section 1<br />
Year 5/5th Class Checklist<br />
Appreciates the difference between maps<br />
and images taken from different perspectives<br />
Recognises the unique features of different<br />
maps<br />
Identifies the correct type of map for a given<br />
purpose<br />
Uses an atlas for research<br />
Reads and creates grid maps<br />
Locates points of interest on a street map<br />
Understands and uses directional language<br />
Understands, uses and creates a map legend<br />
Identifies the main features of a map<br />
Reads and uses a compass rose to determine<br />
direction<br />
Calculates real distance between map<br />
features using a scale and understands<br />
appropriate use of scale<br />
Recognises the position of the five main lines<br />
of latitude and the effect of distance from the<br />
equator on climate and temperature<br />
Understands that tropical storms occur in<br />
different parts of the tropics at different<br />
times of the year and have different names<br />
Recognises the position of the five main lines<br />
of latitude and longitude and uses parallels<br />
and meridians to locate a point on a map<br />
Understands that maps are a vehicle for<br />
providing information and uses this to<br />
research a place<br />
Review sample<br />
NAME<br />
<strong>Using</strong> <strong>Maps</strong> 978-1-84654-917-5 xxviii Prim-Ed Publishing – www.prim-ed.com<br />
BOOK 3
Teachers Resource – Section 2<br />
Year 6/6th Class Checklist<br />
Understands the three ways scale is<br />
presented on a map<br />
Measures distances on a map and converts<br />
measurements from one unit to another<br />
Measures real distances and draws a scaled<br />
map<br />
Understands that larger and smaller squares<br />
are used to enlarge and reduce images to<br />
scale; and that rectangles cause distortion<br />
Uses the Cartesian Coordinate system—one<br />
and four quadrants—to locate features on<br />
a map<br />
Asks research questions about a place from<br />
various resources and presents answers on<br />
a map<br />
Examines thematic maps of the same place<br />
to determine why there may be differences;<br />
e.g. temperature at different times of the year<br />
Considers how information provided in a<br />
map can determine human behaviour; e.g.<br />
weather map of holiday destination and<br />
choice of clothes to pack<br />
Understands the division of the world into<br />
time zones and that places east of the Prime<br />
meridian to 180° are ‘ahead’ of Greenwich<br />
and those to the west are ‘behind’<br />
Understands the concept of density as a<br />
measure of the number of anything; e.g.<br />
population within a specified area (1 km 2 )<br />
Asks research questions to determine<br />
relationships among different places and<br />
presents answers on a map<br />
Review sample<br />
NAME<br />
Prim-Ed Publishing – www.prim-ed.com xxix 978-1-84654-917-5 <strong>Using</strong> <strong>Maps</strong><br />
BOOK 3
Teachers Notes<br />
English<br />
❂❂<br />
Look at mapping words such as scale, key, compass,<br />
latitude, longitude, hemisphere, tropics, equator,<br />
Greenwich time etc. Where do these words come from<br />
and what do they mean? Use a dictionary or the Internet<br />
to define these words.<br />
❂❂<br />
Read the following stories about the world, its countries,<br />
its people and time zones:<br />
––<br />
If You Lived Here: Houses of the World by Giles Laroche<br />
––<br />
Nine O’Clock Lullaby by Marilyn Singer<br />
––<br />
One World, One Day by Barbara Kerley<br />
––<br />
If the World were a Village: a <strong>Book</strong> about the World’s<br />
People by David J Smith<br />
❂❂<br />
Write a letter, postcard or email about a country you have<br />
visited. Pretend you are there now on holiday and tell a<br />
friend or family member back home all about it.<br />
History and Geography<br />
❂❂<br />
Look at the cultural backgrounds within the class group,<br />
even looking back to parents and grandparents. Ask pupils<br />
to find out where their parents or grandparents come<br />
from? When did they settle in this country? Why did they<br />
choose this country?<br />
❂❂<br />
Ask pupils to choose a country to investigate. Find out<br />
things like what is their population, climate, position in the<br />
world, economy—what do they produce or make?<br />
❂❂<br />
Look at the world weather and what affects climate.<br />
❂❂<br />
Look at time zones and the time difference between<br />
countries. Ask pupils to find out the time in three different<br />
countries of their choice.<br />
Links to Other Curriculum Areas<br />
Information and Communication<br />
Technology<br />
❂❂<br />
The world wide web has bought countries closer<br />
together—discuss and make a list of how computers<br />
have helped our world.<br />
❂❂<br />
Use the Internet to investigate any country.<br />
Health and Physical Education<br />
❂❂<br />
Create a grid map on the ground using squares. Ask<br />
pupils to move onto different grid squares. Play a game<br />
of Battleship using these grids. Put all the grid references<br />
pupils are standing on in a container. Draw out a grid<br />
reference one at a time and the person called out goes<br />
out. The last remaining grid reference to be left standing<br />
is the winner.<br />
❂❂<br />
Why is access to fresh water so important in our world?<br />
Do all countries have access to fresh water? Investigate<br />
a third world country that may not have access to fresh<br />
running water; for example, some African countries. What<br />
do they do to find water?<br />
The Arts<br />
❂❂<br />
Create a world globe using papier-mâché. Outline some<br />
basic shapes to represent the continents, then paint it to<br />
show the water and the land.<br />
❂❂<br />
Look at colours and shadings used on natural maps of<br />
countries to represent land features.<br />
❂❂<br />
Look at some old maps—how have maps changed over<br />
the years? Create an old-fashioned map using textured<br />
paper, ink, tea for staining etc.<br />
Review sample<br />
<strong>Using</strong> <strong>Maps</strong> 978-1-84654-917-5 xxx Prim-Ed Publishing – www.prim-ed.com<br />
BOOK 3
Different Views – 1<br />
Section 1<br />
VIEW 1<br />
VIEW 2<br />
VIEW 3<br />
Review sample<br />
Prim-Ed Publishing – www.prim-ed.com 1 978-1-84654-917-5 <strong>Using</strong> <strong>Maps</strong><br />
BOOK 3
Section 1<br />
Different Views – 2<br />
You will need a copy of Different Views – 1.<br />
1. Look at the different views of the soccer game and write the correct letter in each box.<br />
(a) View shows the whole football stadium.<br />
(b) You can see a close up of the players in view .<br />
(c) View shows you the shape of the field.<br />
(d) You can see all the players in views and .<br />
(e) View lets you see the number of the player trying to score.<br />
(f) View lets you see most of the spectators.<br />
(g) View does not give you a view of the whole football stadium.<br />
2. Place a tick or a cross to show what you can and cannot see in each image.<br />
Details Image 1 Image 2 Image 3<br />
(a) The football<br />
(b) The goalpost<br />
(c) The players’ numbers<br />
(d) The spectators<br />
(e) The ground lines<br />
3. Why do you think large television screens are used at football matches?<br />
4. Why are different views useful? Discuss with a partner and write one reason.<br />
Review sample<br />
5. Which image would be most useful to show the layout of the football stadium and the surrounding<br />
area? Explain your answer.<br />
<strong>Using</strong> <strong>Maps</strong> 978-1-84654-917-5 2 Prim-Ed Publishing – www.prim-ed.com<br />
BOOK 3
Identifying <strong>Maps</strong> – 1<br />
Section 1<br />
VICTORIA STREET<br />
CHETWYND STREET<br />
DUDLEY STREET<br />
CAPEL STREET<br />
PEEL STREET<br />
COBDEN STRE<br />
QUEEN STREET<br />
O’CONNELL STREET<br />
QUEEN STREET<br />
LEICESTER STRE<br />
BOUVERIE STR<br />
THERRY STREET<br />
FRANKLIN STREET<br />
SWANSTON STRE<br />
CARDIGAN STREET<br />
LYGON STREET<br />
DRUMMOND STREET<br />
RATHDOWNE STREET<br />
VICTORIA STREET<br />
S<strong>PR</strong>ING STREET<br />
EXHIBITION STREET<br />
WILLIAM STREET<br />
RUSSELL STREET<br />
KING STREET<br />
LATROBE STREET<br />
SWANSTON STREET <strong>PR</strong>INCES BRIDGE ST KILDA ROAD<br />
A<br />
C<br />
D<br />
0–100 m<br />
100–200 m<br />
>200 m<br />
SPENCER STREET<br />
E<br />
LITTLE LONSDALE STREET<br />
LONSDALE STREET<br />
LITTLE BOURKE STREET<br />
BOURKE STREET<br />
LITTLE COLLINS STREET<br />
COLLINS STREET<br />
FLINDERS STREET<br />
ELIZABETH STREET<br />
FRESHWATER PL<br />
YARRA RIVER<br />
RIVERSIDE QUAY<br />
SOUTHBANK BLVD<br />
SOUTHGATE AVE<br />
FALKNER ST<br />
KAVANAGH ST<br />
AUCKLAND<br />
CHRISTCHURCH<br />
Basalt<br />
Obsidian<br />
Greywacke<br />
Argillite<br />
Pounamu<br />
Silcrete<br />
B<br />
WELLINGTON<br />
Review sample<br />
Pahutane flint<br />
Limestone flint<br />
Porcellanite<br />
Chert and<br />
similar stones<br />
Prim-Ed Publishing – www.prim-ed.com 3 978-1-84654-917-5 <strong>Using</strong> <strong>Maps</strong><br />
BOOK 3
Section 1<br />
Identifying <strong>Maps</strong> – 2<br />
You will need a copy of Identifying <strong>Maps</strong> – 1.<br />
A map is a visual representation of a space (land or sea). There are different types of maps used for different<br />
reasons. For example, street maps for locating streets, roads, tracks, shops and community features; Google<br />
<strong>Maps</strong> and satellite images giving many images of a city or land; political maps showing country and county/<br />
state borders; physical maps showing the natural features of the land; resource maps showing what a an area<br />
can produce or its natural resources.<br />
1. Match the name and definitions to the correct maps on the previous page.<br />
2. Discuss the uses of each type of map and write suggestions for each one.<br />
Name and definition<br />
Road or Street map:<br />
A map of streets and roads in<br />
a grid reference system.<br />
Physical or<br />
Natural map:<br />
A map showing natural<br />
features such as land cover,<br />
mountains, forests, water and<br />
oceans.<br />
Satellite map/image:<br />
Photo images taken from<br />
satellites which orbit Earth.<br />
Political map:<br />
<strong>Maps</strong> that are drawn showing<br />
countries borders, counties/<br />
states and capital cities.<br />
Uses<br />
Review sample<br />
Economic or<br />
Resource map<br />
These maps give us<br />
information about what a<br />
country produces or grows. It<br />
would normally use symbols<br />
or colours to represent this.<br />
<strong>Using</strong> <strong>Maps</strong> 978-1-84654-917-5 4 Prim-Ed Publishing – www.prim-ed.com<br />
BOOK 3
Choosing <strong>Maps</strong><br />
<strong>Maps</strong> are a visual way to show information. They can be found in all sorts of places.<br />
Section 1<br />
1. Discuss and write where you can find maps.<br />
2. Write the resource(s) you would use in each situation.<br />
Situation<br />
Resource<br />
(a)<br />
(b)<br />
(c)<br />
(d)<br />
(e)<br />
(f)<br />
(g)<br />
(h)<br />
You are driving to a new friend’s house and<br />
left your mobile phone at home.<br />
You want to look up a country to study for a<br />
school project.<br />
You are playing netball across town and need<br />
to find directions.<br />
You are doing a project on the oceans of the<br />
world.<br />
You want to find out where the new shoe<br />
shop is in your area.<br />
You want to see what countries are on or<br />
near the equator.<br />
You are out and want to show a friend how to<br />
get to your house from school.<br />
Review sample<br />
You want to see the outline shape of a<br />
country.<br />
3. Write an example of a situation when you might use each resource.<br />
(a) Google <strong>Maps</strong> :<br />
(b)<br />
An atlas:<br />
Prim-Ed Publishing – www.prim-ed.com 5 978-1-84654-917-5 <strong>Using</strong> <strong>Maps</strong><br />
BOOK 3
Section 1<br />
<strong>Using</strong> an Atlas<br />
An atlas uses maps and tables to provide lots of information about our world. The contents pages at the front<br />
and the index pages at the back help us to find what we are looking for in an atlas.<br />
1. Use an atlas to find the capital city of each country.<br />
Country<br />
Capital city<br />
(a)<br />
(b)<br />
New Zealand<br />
United Kingdom<br />
(c)<br />
(d)<br />
(e)<br />
(f)<br />
(g)<br />
(h)<br />
United States of America<br />
China<br />
Italy<br />
Canada<br />
Ireland<br />
Russia<br />
2. Use the atlas to find the area of the seven continents. Write them in order from largest to smallest, to the<br />
nearest 100 thousand square kilometres.<br />
(a)<br />
(b)<br />
(c)<br />
(d)<br />
(e)<br />
(f)<br />
(g)<br />
Continents Area km 2<br />
3. Use an atlas to find the area, to the nearest 100 thousand square kilometres, of the world’s five oceans.<br />
Write them in ascending size order.<br />
(a)<br />
(b)<br />
(c)<br />
(d)<br />
(e)<br />
Review sample<br />
Oceans Area km 2<br />
<strong>Using</strong> <strong>Maps</strong> 978-1-84654-917-5 6 Prim-Ed Publishing – www.prim-ed.com<br />
BOOK 3
Grid <strong>Maps</strong>: a Zoo – 1<br />
Section 1<br />
Grid maps use a number and letter coordinate system to make it easy to locate a feature on a map. Street<br />
maps, park and large shop maps generally use the grid reference system.<br />
MAP 1<br />
12<br />
11<br />
10<br />
9<br />
8<br />
7<br />
6<br />
5<br />
4<br />
3<br />
2<br />
1<br />
MAP 2<br />
12<br />
11<br />
10<br />
9<br />
8<br />
7<br />
6<br />
5<br />
A B C D E F G H I J<br />
Review sample<br />
4<br />
3<br />
2<br />
1<br />
A B C D E F G H I J<br />
Prim-Ed Publishing – www.prim-ed.com 7 978-1-84654-917-5 <strong>Using</strong> <strong>Maps</strong><br />
BOOK 3
Section 1<br />
Grid <strong>Maps</strong>: a Zoo – 2<br />
You will need a copy of Grid <strong>Maps</strong>: a Zoo – 1.<br />
1. What do you think these symbols on the zoo maps represent?<br />
(a) = (b) =<br />
(c) = (d) =<br />
(e) = (f) =<br />
2. What animals or features would you find at these grid references?<br />
(a) F6: (b) H9:<br />
(c) E10: (d) E6:<br />
(e) J8: (f) A7:<br />
3. Write the grid references for these animals or features.<br />
(a) gift shop: (b) crocodiles: (c) tigers:<br />
(d) koalas: (e) playground: (f) lions:<br />
4. Discuss the positive and negative features of each map. Write one comment in each box.<br />
Map 1<br />
Map 2<br />
Positive<br />
5. Which map do you find easier to read and to find information? Explain why.<br />
Negative<br />
Review sample<br />
6. Discuss places where each type of map may be used, then write your suggestions.<br />
Map 1<br />
Map 2<br />
<strong>Using</strong> <strong>Maps</strong> 978-1-84654-917-5 8 Prim-Ed Publishing – www.prim-ed.com<br />
BOOK 3
Grid <strong>Maps</strong>: a School – 1<br />
Classroom 3<br />
Basketball/<br />
netball<br />
court<br />
Sandpit<br />
Vegetable<br />
patch<br />
Classroom 1<br />
HALL<br />
Classroom 4<br />
Classroom 5<br />
Classroom 6<br />
LEGEND<br />
Art room<br />
Canteen<br />
Car park<br />
Entrance<br />
Library<br />
Office<br />
Sports<br />
field<br />
Playground<br />
Staffroom<br />
Classroom 2<br />
Classroom 7<br />
8<br />
7<br />
6<br />
5<br />
4<br />
3<br />
2<br />
1<br />
A B C D E F G H I J K L<br />
Section 1<br />
Review sample<br />
Prim-Ed Publishing – www.prim-ed.com 9 978-1-84654-917-5 <strong>Using</strong> <strong>Maps</strong><br />
BOOK 3
Section 1<br />
Grid <strong>Maps</strong>: a School – 2<br />
You will need a copy of Grid <strong>Maps</strong>: a School – 1.<br />
1. Write the grid references for these school areas.<br />
(a) Entrance: (b) Canteen: (c) Library:<br />
(d) Classroom 6: (e) Classroom 2: (f) Art room:<br />
2. What features/areas are at these grid references?<br />
(a) G1, H1: (b) L6:<br />
(c) G3, H3: (d) A2, A3, A4:<br />
3. These features are not included on the map. Write where you think each one should be located and say<br />
why. Draw a symbol for each feature.<br />
(a)<br />
(b)<br />
(c)<br />
Toilets<br />
Drinking<br />
fountains<br />
Seats or<br />
benches<br />
Where? Why? Symbol<br />
4. Discuss other information that could be shown on this map to help a visitor to the school. Write some<br />
suggestions.<br />
5. (a) Lightly shade the squares for each feature on the map.<br />
(b)<br />
Review sample<br />
Use grid references to describe a route you would take to visit all places around the school. Name<br />
each feature along the way.<br />
<strong>Using</strong> <strong>Maps</strong> 978-1-84654-917-5 10 Prim-Ed Publishing – www.prim-ed.com<br />
BOOK 3
8<br />
7<br />
6<br />
5<br />
4<br />
3<br />
2<br />
1<br />
Grid <strong>Maps</strong>: a Classroom – 1<br />
A B C D E F G H I J<br />
Section 1<br />
Review sample<br />
Prim-Ed Publishing – www.prim-ed.com 11 978-1-84654-917-5 <strong>Using</strong> <strong>Maps</strong><br />
BOOK 3
Section 1<br />
Grid <strong>Maps</strong>: a Classroom – 2<br />
Rooms such as classrooms have both immovable and moveable features. Immovable features such as doors,<br />
windows, sinks, cupboards, walls and power sockets can affect where moveable objects such as tables, chairs<br />
and computers can be placed.<br />
You will need a copy of Grid <strong>Maps</strong>: a Classroom – 1.<br />
1. List all the moveable and immovable features of your classroom and draw a symbol for each.<br />
Moveable<br />
Immoveable<br />
feature symbol feature symbol<br />
2. Use your symbols to mark each feature on the blank grid.<br />
3. Record the grid reference of six of your classroom features and show with a tick if they are moveable or<br />
immoveable.<br />
Classroom feature Grid reference Moveable Immoveable<br />
4. Discuss why the moveable features in your class have been placed where they are. Choose one feature<br />
and say why it is in that place.<br />
Good things<br />
Review sample<br />
Things that could be improved<br />
5. Can moveable features be placed just anywhere? Explain your answer.<br />
<strong>Using</strong> <strong>Maps</strong> 978-1-84654-917-5 12 Prim-Ed Publishing – www.prim-ed.com<br />
BOOK 3
7<br />
6<br />
5<br />
4<br />
3<br />
2<br />
1<br />
Street <strong>Maps</strong> – 1<br />
LEGEND<br />
Theatre<br />
Fuel<br />
Medical centre<br />
Train station<br />
Fire station<br />
Sports centre<br />
Zoo<br />
Police station<br />
Quay<br />
Shopping centre<br />
School<br />
Park<br />
A B C D E F G H I<br />
Section 1<br />
Review sample<br />
Prim-Ed Publishing – www.prim-ed.com 13 978-1-84654-917-5 <strong>Using</strong> <strong>Maps</strong><br />
BOOK 3
Section 1<br />
Street <strong>Maps</strong> – 2<br />
You will need a copy of Street <strong>Maps</strong> – 1.<br />
1. Name three features that stand out on the map to you.<br />
2. What features would you find at these grid references?<br />
(a) G4: (b) B3:<br />
(c) D7: (d) H6:<br />
3. Write the grid references for these features on the map.<br />
(a) zoo: (b) police station:<br />
(c) school: (d) two shopping centres:<br />
4. Why do you think there are railway stations near the quays?<br />
5. Colour some of the blank shapes purple where you think it would be good to have a cafe or restaurant.<br />
Give the grid reference of each shape and say why you chose the location.<br />
Grid reference<br />
Reason for location<br />
6. What other features would you add to this town? Use different colours to identify the features you<br />
choose. Complete the table.<br />
Feature Colour Grid reference Reason for adding and the location<br />
Review sample<br />
<strong>Using</strong> <strong>Maps</strong> 978-1-84654-917-5 14 Prim-Ed Publishing – www.prim-ed.com<br />
BOOK 3
Directional Language<br />
Section 1<br />
1. Fill in the missing letters from these direction words.<br />
(a) o r d (b) a k (c) s t h<br />
(d) f t (e) n t h (f) b i n d<br />
(g) r n (h) a s (i) r g t<br />
(j) w t (k) a o v (l) e w<br />
2. Use directional language to describe where you are currently sitting in relation to the teacher’s desk.<br />
3. Describe how you would get from your desk to another location in the classroom.<br />
4. Use direction language to describe the route you would take to get to the school office from your<br />
classroom.<br />
5. Use direction language to plan a route of five stages from your classroom to another area of the school<br />
for a partner to follow. Write a question for your partner to answer at the end of each stage. For example,<br />
Turn right from the classroom and take 10 paces. What do you see on your left?<br />
Stages Question Answer<br />
Review sample<br />
Prim-Ed Publishing – www.prim-ed.com 15 978-1-84654-917-5 <strong>Using</strong> <strong>Maps</strong><br />
BOOK 3
Section 1<br />
A Map Legend<br />
A map legend explains features on a map. A legend may include symbols, colours and lines to represent<br />
features on a map.<br />
1. Name the feature each symbol could represent.<br />
(a)<br />
(b)<br />
(c)<br />
(d)<br />
(e)<br />
(f)<br />
(g)<br />
(h)<br />
2. Draw a symbol to represent each feature.<br />
Railway line Harbour Train station<br />
Fire station Mobile phone tower Museum<br />
Post office School Campsite<br />
3. Look at different maps to find the symbols, colours or lines used to represent these natural features.<br />
Grassland Lake Desert<br />
Review sample<br />
River Forest Waterfall<br />
Mountains Cliffs Wetlands<br />
<strong>Using</strong> <strong>Maps</strong> 978-1-84654-917-5 16 Prim-Ed Publishing – www.prim-ed.com<br />
BOOK 3
Complete the legend for the features on Paradise Island.<br />
LEGEND<br />
Reading a Map – 1<br />
PARADISE ISLAND<br />
Beach Cliffs Mountains<br />
BEACH FISHING PIER BOAT RAMP<br />
Lake Wetlands River<br />
CAMPING<br />
LIGHTHOUSE HOUSE<br />
Forest Village Hotel<br />
FERRY<br />
TERMINAL<br />
WET-<br />
LANDS<br />
BRIDGE<br />
MOUNTAINS<br />
Ferry terminal Boat ramp Fishing pier<br />
LAKE<br />
RIVER<br />
BEACH<br />
CLIFFS<br />
FOREST<br />
VILLAGE<br />
BEACH<br />
Review sample<br />
Lighthouse Camping ground Bridge<br />
Bus route Bus stops<br />
HOTEL<br />
CLIFFS<br />
Section 1<br />
N<br />
NW NE<br />
W E<br />
SW SE<br />
S<br />
Prim-Ed Publishing – www.prim-ed.com 17 978-1-84654-917-5 <strong>Using</strong> <strong>Maps</strong><br />
BOOK 3
Section 1<br />
Reading a Map –2<br />
You will need a copy of Reading a Map – 1.<br />
1. Use the eight point compass to write the correct direction in each box.<br />
(a) There is no beach on the of the island.<br />
(b) The mountains are to the of the forest.<br />
(c) The camping ground is to the of the lake.<br />
(d) The fishing pier is to of the ferry terminal.<br />
(e) The village is to the of the lake.<br />
(f) The hotel is to the of the lighthouse.<br />
(g) The lake is to the of the wetlands.<br />
(h) The boat ramp is to the of the fishing pier.<br />
2. (a) The island needs a bus service. On the map draw a route and<br />
bus stops that would be useful for as many people as possible.<br />
(b)<br />
On the legend, add symbols for the bus route and bus stops.<br />
3. People like to explore the natural features of Paradise Island.<br />
(a)<br />
What features could be built to help people explore the<br />
island more easily? Draw a symbol for each feature.<br />
Feature Symbol How the feature will help<br />
Review sample<br />
315º<br />
NW<br />
270º<br />
225º<br />
W<br />
SW<br />
360º<br />
N<br />
S<br />
180º<br />
NE<br />
SE<br />
45º<br />
E<br />
135º<br />
90º<br />
(b)<br />
<strong>Using</strong> the symbols, add each feature to the map.<br />
<strong>Using</strong> <strong>Maps</strong> 978-1-84654-917-5 18 Prim-Ed Publishing – www.prim-ed.com<br />
BOOK 3
Creating a Map<br />
Section 1<br />
1. Design a map of your own ‘Paradise Island’. Look at different maps to see features you could include<br />
and symbols you could use. Include a legend to explain your map. (Don’t forget to included a compass<br />
rose!)<br />
LEGEND<br />
2. Show your map to a partner. Record the information he or she discovers about Paradise Island from your<br />
map.<br />
Partner feedback<br />
Review sample<br />
3. Discuss with your partner how your map could be improved. What changes do you need to make?<br />
Improvements/changes<br />
Prim-Ed Publishing – www.prim-ed.com 19 978-1-84654-917-5 <strong>Using</strong> <strong>Maps</strong><br />
BOOK 3
Section 1<br />
The Compass Rose<br />
The compass rose is a diagram showing the four or eight points of direction. Most maps include a compass<br />
rose with north pointing to the top of the page. The features represented on the map are positioned as they<br />
relate to north.<br />
Pool<br />
Garage<br />
Cow paddock<br />
1. Name the compass directions to match these bearings.<br />
(a) 135° = (b) 270° =<br />
(c) 360° = (d) 45° =<br />
(e) 225° = (f) 90° =<br />
2. Looking at the map of the property above, what would you find at these compass directions?<br />
(a) north: (b) west:<br />
(c) east: (d) south:<br />
(e) south-east: (f) north-west:<br />
3. Discuss possible reasons for the location of the swimming pool and the chicken coop. Write one<br />
suggestion for each feature.<br />
Feature<br />
Pig pen<br />
270º<br />
225º<br />
W<br />
SW<br />
360º<br />
N<br />
S<br />
180º<br />
Dam<br />
NE<br />
SE<br />
45º<br />
E<br />
135º<br />
90º<br />
Reason for building<br />
House<br />
Stables<br />
Chicken coop<br />
315º<br />
NW<br />
Review sample<br />
swimming pool<br />
chicken coop<br />
<strong>Using</strong> <strong>Maps</strong> 978-1-84654-917-5 20 Prim-Ed Publishing – www.prim-ed.com<br />
BOOK 3
Map Features: Madagascar – 1<br />
Section 1<br />
MADAGASCAR<br />
Antsiranana<br />
N<br />
W<br />
E<br />
S<br />
Mahajanga<br />
ANTANANARIVO<br />
Fianarantsoa<br />
Toamasina<br />
Review sample<br />
LEGEND<br />
capital city<br />
Toliara<br />
province capital<br />
province border<br />
60 180 300 km<br />
0 1 2 3 4 5 cm<br />
Prim-Ed Publishing – www.prim-ed.com 21 978-1-84654-917-5 <strong>Using</strong> <strong>Maps</strong><br />
BOOK 3
Section 1<br />
Map Features: Madagascar – 2<br />
You will need a copy of Map Features: Madagascar – 1 and access to an atlas or the Internet.<br />
1. There are four main features of any map. Explain the role of each one.<br />
Feature<br />
Role<br />
(a)<br />
(b)<br />
Title<br />
Legend<br />
(c)<br />
(d)<br />
Scale<br />
Compass<br />
rose<br />
2. Write the answers and explain how the map provides the answer to each question.<br />
(a)<br />
(b)<br />
(c)<br />
(d)<br />
Question Answer Explanation<br />
What is the capital city of<br />
Madagascar?<br />
How many provinces is<br />
Madagascar divided into?<br />
In what direction is the city<br />
of Toliara from Antsiranana?<br />
What is the approximate distance, ‘as the crow flies’,<br />
between each provincial capital?<br />
Toamasina and Toliara<br />
Mahajanga and<br />
Fianarantsoa<br />
Antananarivo and<br />
Antsiranana<br />
3. Look at other types of maps of Madagascar. Choose some features you could add to the<br />
map to provide more information. List the features and their symbols on this legend.<br />
Feature<br />
Review sample<br />
Symbol<br />
<strong>Using</strong> <strong>Maps</strong> 978-1-84654-917-5 22 Prim-Ed Publishing – www.prim-ed.com<br />
BOOK 3
Map Scales: Tasmania – 1 Section 1<br />
TASMANIA<br />
Marrawah<br />
Burnie<br />
Devonport<br />
George Town<br />
Marrawah<br />
Launceston<br />
Strahan<br />
MAP A<br />
Bronte Park<br />
HOBART<br />
Marrawah<br />
Strahan<br />
Launceston<br />
Bicheno<br />
Rocky Cape<br />
National Park<br />
Burnie<br />
Cradle Mountain<br />
Lake<br />
Gordon<br />
Strathgordon<br />
Narawntapu<br />
National Park<br />
Devonport<br />
Walls of Jerusalem<br />
National Park Great<br />
Lake<br />
Cradle Mountain<br />
Lake St. Clair<br />
National Park<br />
Franklin<br />
Lower Gordon<br />
Wild Rivers<br />
National Park<br />
Derwent Bridge<br />
Lake<br />
King William<br />
Strahan<br />
Lake<br />
Echo<br />
Bronte Park<br />
Mt. Field<br />
National Park<br />
MAP B<br />
George Town<br />
Arthurs<br />
Lake<br />
Cradle Mountain<br />
Derwent Bridge<br />
Strathgordon<br />
Launceston<br />
Campbell Town<br />
Lake<br />
Sorell<br />
Melton<br />
Mowbray<br />
Bronte Park<br />
Southport<br />
HOBART<br />
Swansea<br />
Mt. William<br />
National Park<br />
Ben Lomond<br />
National Park<br />
Bicheno<br />
Campbell Town<br />
Melton<br />
Mowbray<br />
Review sample<br />
Bicheno<br />
Swansea<br />
Freycinet<br />
National<br />
Park<br />
Maria Island<br />
National Park<br />
Port Arthur<br />
Lake<br />
Pedder<br />
Southwest<br />
National Park<br />
Harts Mountain<br />
National Park<br />
HOBART<br />
Port Arthur<br />
MAP C<br />
Southport<br />
TASMAN<br />
SEA<br />
Prim-Ed Publishing – www.prim-ed.com 23 978-1-84654-917-5 <strong>Using</strong> <strong>Maps</strong><br />
BOOK 3
Section 1<br />
Map Scales: Tasmania – 2<br />
A map is a visual representation of a real area on the ground. The scale of a map identifies the relationship<br />
between the distance on the ground and on the map.<br />
Everything on a map is scaled down by the same proportion, so what is bigger or smaller on the ground is<br />
bigger or smaller on the map.<br />
A map showing a small area in great detail is known as a large-scale map. A map showing a large area in less<br />
detail is known as a small-scale map.<br />
You will need a copy of Map Scales: Tasmania – 1 and access to the Internet.<br />
1. Match each map of Tasmania to its correct scale:<br />
(a) Map A (b) Map B (c) Map C<br />
(1)<br />
40<br />
80<br />
120<br />
160<br />
200 km<br />
0 1 2 3 4 5 cm<br />
(2)<br />
70<br />
140<br />
210<br />
280<br />
350 km<br />
0 1 2 3 4 5 cm<br />
(3)<br />
2. (a) Use the scale of each map to calculate the distance between Hobart and Launceston.<br />
(b)<br />
Map A Map B Map C<br />
Which of the three maps is the most accurate?<br />
3. Use the scale of each map to find the distance, as the crow flies, between places in Tasmania.<br />
(a) Map A Marrawah to Hobart<br />
Launceston to Strahan<br />
Bronte Park to Bicheno<br />
(b) Map B Hobart to Bicheno<br />
Launceston to Bronte Park<br />
Strahan to Marrawah<br />
(c) Map C Hobart to Devonport<br />
Marrawah to Bronte Park<br />
Review sample<br />
Strahan to Bicheno<br />
4. Compare the size, scale and detail of the three maps of Tasmania. Explain the difference between smalland<br />
large-scale maps and when each would be used.<br />
0<br />
30<br />
1<br />
60<br />
2<br />
90<br />
3<br />
120<br />
4<br />
150 km<br />
5 cm<br />
<strong>Using</strong> <strong>Maps</strong> 978-1-84654-917-5 24 Prim-Ed Publishing – www.prim-ed.com<br />
BOOK 3
70°<br />
60°<br />
50°<br />
40°<br />
30°<br />
20°<br />
10°<br />
0°<br />
10°<br />
20°<br />
30°<br />
40°<br />
50°<br />
60°<br />
160°<br />
160°<br />
150°<br />
150°<br />
140°<br />
140°<br />
130°<br />
130°<br />
120°<br />
120°<br />
110°<br />
110°<br />
Latitude and Longitude – 1<br />
Section 1<br />
100°<br />
90°<br />
80°<br />
70° 60° 50° 40° 30° 20° 10° 0° 10° 20° 30° 40° 50° 60° 70° 80° 90° 100° 110° 120° 130° 140° 150° 160° 170° 180° 170°<br />
100° 90° 80° 70° 60° 50° 40° 30° 20° 10° 0° 10° 20° 30° 40° 50° 60° 70° 80° 90° 100° 110° 120° 130° 140° 150° 160° 170° 180° 170°<br />
70°<br />
60°<br />
50°<br />
40°<br />
30°<br />
20°<br />
10°<br />
0°<br />
10°<br />
20°<br />
30°<br />
40°<br />
50°<br />
60°<br />
Review sample<br />
Prim-Ed Publishing – www.prim-ed.com 25 978-1-84654-917-5 <strong>Using</strong> <strong>Maps</strong><br />
BOOK 3
Section 1<br />
Latitude and Longitude – 2<br />
Images of Earth are divided into sections by lines of latitude and longitude. <strong>Using</strong> lines of latitude and<br />
longitude helps us to locate places on a map or on the ground. Lines of latitude are called parallels. Lines of<br />
longitude are also called meridians.<br />
You will need a copy of Latitude and Longitude – 1.<br />
1. (a) What and where is the equator?<br />
(b)<br />
What and where is the Prime meridian?<br />
(c)<br />
What and where is the International Date Line?<br />
2. With a partner, look at the world map and a globe to find similarities and differences between lines of<br />
latitude and lines of longitude.<br />
latitude<br />
longitude<br />
Differences<br />
Similarities<br />
3. Why do you think lines of latitude and lines of longitude make it easier to locate a place on a map?<br />
4. In which country does each pair of lines meet?<br />
Review sample<br />
Country Latitude Longitude<br />
(a) 30° S 60° W<br />
(b) 30° N 90° E<br />
(c) 60° N 120° W<br />
(d) 30° N 60° E<br />
(e) 30° S 150° E<br />
(f) 40° N 100° W<br />
<strong>Using</strong> <strong>Maps</strong> 978-1-84654-917-5 26 Prim-Ed Publishing – www.prim-ed.com<br />
BOOK 3
Hemispheres, Tropics and Circles – 1 Section 1<br />
Review sample<br />
Prim-Ed Publishing – www.prim-ed.com 27 978-1-84654-917-5 <strong>Using</strong> <strong>Maps</strong><br />
BOOK 3
Section 1<br />
Hemispheres, Tropics and Circles – 2<br />
You will need a copy of Hemispheres, Tropics and Circles – 1 and access to an atlas or the Internet.<br />
1. (a) Use a world map or globe to find the name of each line of latitude.<br />
(b)<br />
(c)<br />
Write the name of some countries that each line passes through.<br />
Mark the five main lines of latitude on the map.<br />
Line Name Countries<br />
0º<br />
23.5º North<br />
23.5º South<br />
66.5º North<br />
66.5º South<br />
2. (a) Find a simple world vegetation map. Use the legend to decipher the map. Create a legend for your<br />
map and colour the map to show the same information.<br />
(b)<br />
(c)<br />
To one side of the map use brackets, }, to label each region.<br />
Write some information about the vegetation found in each region.<br />
Region<br />
Tropics<br />
Vegetation<br />
Review sample<br />
Temperate<br />
Arctic/<br />
Antarctic<br />
<strong>Using</strong> <strong>Maps</strong> 978-1-84654-917-5 28 Prim-Ed Publishing – www.prim-ed.com<br />
BOOK 3
Stormy Weather – 1<br />
HURRICANES<br />
WHEN?<br />
NORTH<br />
AMERICA<br />
SOUTH<br />
AMERICA<br />
ATLANTIC<br />
OCEAN<br />
HURRICANES<br />
WHEN?<br />
TROPICAL CYCLONES<br />
WHEN?<br />
ARCTIC OCEAN<br />
AFRICA<br />
ASIA<br />
TROPICAL CYCLONES<br />
WHEN?<br />
INDIAN<br />
OCEAN<br />
TROPICAL CYCLONES<br />
WHEN?<br />
TYPHOONS<br />
WHEN?<br />
AUSTRALIA<br />
PACIFIC<br />
OCEAN<br />
SOUTHERN OCEAN<br />
PACIFIC<br />
OCEAN<br />
Section 1<br />
Review sample<br />
Prim-Ed Publishing – www.prim-ed.com 29 978-1-84654-917-5 <strong>Using</strong> <strong>Maps</strong><br />
BOOK 3
Section 1<br />
Stormy Weather – 2<br />
Hurricanes, typhoons and tropical cyclones are different names given to the same weather phenomenon.<br />
You will need a copy of Stormy Weather – 1.<br />
1. Use the map legend to complete each label on the map, saying when each storm occurs.<br />
Name of storm<br />
LEGEND<br />
Symbol<br />
Hurricane: May–November<br />
Hurricane: June–November<br />
Tropical cyclone: April–December<br />
Tropical cyclone: October–May<br />
Tropical cyclone:<br />
Rare in South Atlantic<br />
Typhoons: April–January<br />
2. Match the names of the storm with the areas in which they occur.<br />
(a) Hurricane • • North-west Pacific Ocean<br />
(b) Tropical cyclone • • North-east Pacific and North Atlantic oceans<br />
(c) Typhoon • • Indian Ocean, South Pacific and South Atlantic oceans<br />
3. (a) What information does the map give about where hurricanes, typhoons and tropical cyclones occur?<br />
(b)<br />
Review sample<br />
Write three research questions you could ask to help in an investigation about hurricanes, typhoons<br />
and tropical cyclones.<br />
<strong>Using</strong> <strong>Maps</strong> 978-1-84654-917-5 30 Prim-Ed Publishing – www.prim-ed.com<br />
BOOK 3
Describing Locations<br />
Section 1<br />
You will need an atlas or access to the Internet.<br />
1. In which country and continent does each set of coordinates locate?<br />
Latitude<br />
Coordinates<br />
Longitude<br />
Country and Continent<br />
(a) 30° N 15° E<br />
(b) 60° N 15° E<br />
(c) 50° N 105° W<br />
(d) 40° N 100° E<br />
(e) 65° N 20° W<br />
(f) 20° N 105° E<br />
(g) 20° S 65° W<br />
(h) 45° S 170° E<br />
2. Find the latitude and longitude coordinates of each capital city.<br />
Include north or south for latitude and east or west for longitude.<br />
Country Capital city Latitude Longitude<br />
(a) Italy Rome<br />
(b) Australia Canberra<br />
(c) Mexico Mexico City<br />
(d) Japan Tokyo<br />
(e) Chile Santiago<br />
3. Write the latitude/longitude location for one city on each populated continent.<br />
Review sample<br />
Country<br />
City<br />
Latitude<br />
Location<br />
Longitude<br />
Prim-Ed Publishing – www.prim-ed.com 31 978-1-84654-917-5 <strong>Using</strong> <strong>Maps</strong><br />
BOOK 3
Section 1<br />
Continent Research<br />
1. Write some questions for each aspect that could be asked to guide research about any populated<br />
continent.<br />
Aspect<br />
Questions<br />
Position on<br />
world map<br />
Physical<br />
features<br />
Climate and<br />
weather<br />
Natural<br />
resources<br />
and<br />
land use<br />
Political<br />
divisions<br />
Review sample<br />
Population<br />
density<br />
2. Choose one aspect to research for one continent. Present your research on a map including a title, a<br />
legend, a scale and a compass rose.<br />
<strong>Using</strong> <strong>Maps</strong> 978-1-84654-917-5 32 Prim-Ed Publishing – www.prim-ed.com<br />
BOOK 3
Name Assessment 1 Section 1<br />
Different Types of <strong>Maps</strong><br />
Physical Political Resource Road<br />
1. For each map, write its correct name.<br />
Explain the different features each type of map shows and give examples of when each type of map<br />
would be used.<br />
(a)<br />
Map Features Uses<br />
CAPEL STREET<br />
PEEL STREET<br />
(b)<br />
WILLIAM STREET<br />
(c)<br />
(d)<br />
QUEEN STREET<br />
QUEEN STREET<br />
THERRY STREET<br />
LONSDALE STREET<br />
LATROBE STREET<br />
LITTLE LONSDALE STREET<br />
LITTLE BOURKE STREET<br />
BOURKE STREET<br />
FRANKLIN STREET<br />
LITTLE COLLINS STREET<br />
COLLINS STREET<br />
FLINDERS STREET<br />
ELIZABETH STREET<br />
FRESHWATER PL<br />
RUSSELL STREET<br />
VICTORIA STREET<br />
EXHIBITION STREET<br />
SWANSTON STREET <strong>PR</strong>INCES BRIDGE ST KILDA ROAD<br />
YARRA RIVER<br />
RIVERSIDE QUAY<br />
SOUTHBANK BLVD<br />
SOUTHGATE AVE<br />
AUKLAND<br />
FALKNER ST<br />
KAVANAGH ST<br />
LEGEND<br />
0-100m<br />
WELLINGTON<br />
100-200m<br />
200m - ><br />
S<strong>PR</strong>ING STREET<br />
Review sample<br />
CHRISTCHURCH<br />
LEGEND<br />
Basalt<br />
Obsidian<br />
Greywacke<br />
Argillite<br />
Pounamu<br />
Silcrete<br />
Prim-Ed Publishing – www.prim-ed.com 33 978-1-84654-917-5 <strong>Using</strong> <strong>Maps</strong><br />
BOOK 3
Section 1<br />
Assessment 2<br />
Name<br />
Reading a Map<br />
Aidan<br />
Arbon<br />
Allach<br />
ROAD<br />
TOWN<br />
VILLAGE<br />
ANGUS ISLAND<br />
KEY 360º<br />
270º<br />
225º<br />
W<br />
SW<br />
N<br />
S<br />
180º<br />
NE<br />
SE<br />
45º<br />
E<br />
135º<br />
90º<br />
SCALE: 1 CM = 10 KM<br />
1. Name the four features on a map that help us interpret the information it provides.<br />
2. (a) What is the scale of the map?<br />
(b) What is the total distance of the coast road around the island?<br />
(c) What is the shortest distance, by road, from:<br />
(i) Angus to Allach (ii) Allach to Aidan (ii) Arbon to Aidan<br />
3. Which town do you think could be the main one on the island? Explain your choice.<br />
Angus<br />
315º<br />
NW<br />
Review sample<br />
4. Which town or direction?<br />
(a)<br />
is directly west of Allach.<br />
(b) Arbon is to the of Aidan.<br />
(c) Angus lies to the of the island’s other towns.<br />
<strong>Using</strong> <strong>Maps</strong> 978-1-84654-917-5 34 Prim-Ed Publishing – www.prim-ed.com<br />
BOOK 3
Name Assessment 3 Section 1<br />
You will also<br />
need an atlas<br />
to complete<br />
this page.<br />
60 N<br />
30 W<br />
30 W<br />
20 W<br />
Locating Places<br />
10 W 0 10 E 20 E 30 E 40 E 50 E 60 E 70 E<br />
60 N<br />
70 E<br />
1. How does the map tell you which hemisphere the continent of Europe is in?<br />
2. (a) Which five European countries lie completely or mostly to the west of the Prime meridian?<br />
(b)<br />
(c)<br />
(d)<br />
50 N<br />
20 W<br />
Hamburg in Germany and Odense in Denmark lie very close to the same line of longitude.<br />
Which one is it?<br />
Madrid<br />
Odense<br />
Hamburg<br />
Frankfurt Prague<br />
Czech Republic<br />
40 N<br />
40 N<br />
10 W<br />
50 E<br />
Which five European countries does the Arctic Circle pass through?<br />
Write a sentence about the link between the equator and cities of Kharkov in the Ukraine, Krakow in<br />
Poland, Prague in the Czech Republic and Frankfurt in Germany.<br />
Krakow<br />
Kharkov<br />
0 10 E 20 E 30 E 40 E<br />
1: 28,000,000<br />
Review sample<br />
50 N<br />
60 E<br />
3. Use lines of latitude and longitude to describe the location of each capital city.<br />
(a) Madrid: between 40º N and 50º N; 0º and 10º W (b) Paris:<br />
(c) Warsaw: (d) Rome:<br />
(e) Dublin: (f) Minsk:<br />
(g) Moscow: (h) Sofia:<br />
Prim-Ed Publishing – www.prim-ed.com 35 978-1-84654-917-5 <strong>Using</strong> <strong>Maps</strong><br />
BOOK 3
Section 1<br />
Assessment 4<br />
Name<br />
Rainfall – Australia<br />
You will also need an atlas to complete this page.<br />
120 E 135 E 150 E<br />
15 S<br />
15 S<br />
1. How does the map tell you which hemisphere the continent of Australia is in?<br />
2. (a) Look at a physical map of Australia. What natural features do you think affect the annual rainfall of the<br />
east coast of the country?<br />
(b)<br />
30 S<br />
1,600<br />
1,200<br />
800<br />
400<br />
200<br />
0<br />
LEGEND (mm per year)<br />
Suggest reasons for Tasmania’s high annual rainfall.<br />
3. Compare the annual rainfall of the tropical and temperate regions of Australia.<br />
Tropical regions<br />
120 E<br />
135 E<br />
Annual rainfall<br />
150 E<br />
30 S<br />
Review sample<br />
Temperate regions<br />
4. Suggest a reason why central Australia is very dry.<br />
<strong>Using</strong> <strong>Maps</strong> 978-1-84654-917-5 36 Prim-Ed Publishing – www.prim-ed.com<br />
BOOK 3
<strong>Maps</strong> and Scales – 1<br />
Section 2<br />
A map is a visual representation of a real area on the ground.<br />
The scale of a map identifies the relationship between distance on the ground and on the map. Scales vary<br />
with the amount of detail represented. Everything on a map is scaled by the same proportion, so what looks<br />
bigger or smaller in real life is bigger or smaller on a map.<br />
There are three types of scales used on maps.<br />
Match the type of scale to its description by shading both the same colour.<br />
Scale<br />
Line scale<br />
Ratio scale<br />
Written scale<br />
Smithton<br />
Description<br />
A ratio is used to represent the scale.<br />
For example, 1:100,000 means 1 cm = 100,000 cm, which is the same as 1 km.<br />
The scale amount is written to tell us what each centimetre represents.<br />
A line that shows the distance that is represented, usually for each centimetre.<br />
Cradle Mountain<br />
Devonport<br />
Mount Ossa<br />
Eldon Peak<br />
Queenstown<br />
Bridport<br />
Launceston<br />
Campbell Town<br />
Swansea<br />
Great<br />
Oyster<br />
Bay<br />
Review sample<br />
Bay of<br />
Fires<br />
Bicheno<br />
South West<br />
National Park<br />
HOBART<br />
0 20 40 60 80 km<br />
Scale: 1 cm = 20 km<br />
Storm<br />
Bay<br />
TASMANIA<br />
Prim-Ed Publishing – www.prim-ed.com 37 978-1-84654-917-5 <strong>Using</strong> <strong>Maps</strong><br />
BOOK 3
Section 2<br />
<strong>Maps</strong> and Scales – 2<br />
You will need a copy of <strong>Maps</strong> and Scales – 1 and access to the Internet.<br />
1. What type of scale has been used on the map of Tasmania?<br />
2. Use the scale to calculate the distances between these cities or features, ‘as the crow flies’.<br />
From To Distance in centimetres Distance in kilometres<br />
(a) Devonport Launceston<br />
(b) Bridport Bay of Fires<br />
(c) Hobart Swansea<br />
(d) Launceston Mount Ossa<br />
(e) Smithton Cradle Mountain<br />
(f) Storm Bay Great Oyster Bay<br />
3. Suggest reasons why the location of each place has been important to its development.<br />
(a)<br />
(b)<br />
(c)<br />
Hobart<br />
Launceston<br />
Devonport<br />
4. Use additional resources to find the name of:<br />
(a)<br />
(b)<br />
the islands to the north-east of Tasmania.<br />
the stretch of water between Tasmania and<br />
mainland Australia.<br />
5. (a) Find a map of the major roads in Tasmania. Add the roads to the map.<br />
(b)<br />
Review sample<br />
Compare a physical map of Tasmania with the road map. How do you think the physical features of<br />
Tasmania have affected where towns have developed and where roads have been built?<br />
<strong>Using</strong> <strong>Maps</strong> 978-1-84654-917-5 38 Prim-Ed Publishing – www.prim-ed.com<br />
BOOK 3
N<br />
<strong>Using</strong> Scale and Direction – 1<br />
PARKLANDS LEISURE AREA<br />
Section 2<br />
W<br />
E<br />
Basketball court<br />
S<br />
Gym<br />
Netball court<br />
Cricket<br />
Tennis courts<br />
Cafe<br />
Office<br />
Car park<br />
Review sample<br />
Pool<br />
Spa<br />
KEY/LEGEND<br />
seats/benches<br />
entrance<br />
path<br />
0 5 10 15 20 m<br />
Scale: 1 cm = 5 m<br />
Prim-Ed Publishing – www.prim-ed.com 39 978-1-84654-917-5 <strong>Using</strong> <strong>Maps</strong><br />
BOOK 3
Section 2<br />
<strong>Using</strong> Scale and Direction – 2<br />
You will need a copy of <strong>Using</strong> Scale and Direction – 1.<br />
1. Circle the scale which has been used on the map.<br />
(a) 1 mm = 5 m (b) 1 cm = 5 m (c) 5 cm = 5 m<br />
2. Use the scale to work out the size of each area.<br />
(a) The swimming pool: m 2 (b) The netball court: m 2<br />
(c) One tennis court: m 2 (d) One cricket pitch: m 2<br />
3. (a) How could you measure and work out the length of the paths?<br />
(b) Path length: m<br />
4. Write the direction of each feature from the cafe.<br />
(a) The car park: (b) The netball court:<br />
(c) The gym: (d) The spa:<br />
5. Calculate the shortest distance and the direction each person travels.<br />
Person From To Distance Direction<br />
(a) Mike Car park Basketball court<br />
(b) Tracey Pool Gym<br />
(c) Sally Tennis court Cafe<br />
(d) Geoffrey Cricket pitch Car park<br />
6. If Mike walked from the car park to the basketball court via the east path and Geoffrey travelled from the<br />
car park to the basketball court via the west path, who walked further?<br />
7. At what time of day, early morning or late afternoon, would it be better to play each sport (avoiding full<br />
sun)? On what fact or opinion are you making your choice?<br />
Sport Time of day Explanation<br />
swimming<br />
cricket<br />
basketball<br />
netball<br />
tennis<br />
Review sample<br />
<strong>Using</strong> <strong>Maps</strong> 978-1-84654-917-5 40 Prim-Ed Publishing – www.prim-ed.com<br />
BOOK 3
Drawing a Map to Scale – 1<br />
Draw a map of your classroom to scale.<br />
Section 2<br />
Review sample<br />
Prim-Ed Publishing – www.prim-ed.com 41 978-1-84654-917-5 <strong>Using</strong> <strong>Maps</strong><br />
BOOK 3
Section 2<br />
Drawing a Map to Scale – 2<br />
You will need a copy of Drawing a Map to Scale – 1.<br />
1. Measure the dimensions of the room and work out a scale.<br />
length width scale<br />
2. Measure all the features you want to add and the size they will be on the map.<br />
Immoveable feature<br />
Moveable feature<br />
real size scale size real size scale size<br />
3. On the grid paper, add features to create a map of your classroom. Include a compass rose and a scale.<br />
4. (a) What score out of ten would you give your map? /10<br />
(b) How could your map be improved?<br />
5. (a) Why do you think drawing a map to scale is important?<br />
Review sample<br />
(b)<br />
Give an example of a problem that might occur if an inaccurate map is used.<br />
<strong>Using</strong> <strong>Maps</strong> 978-1-84654-917-5 42 Prim-Ed Publishing – www.prim-ed.com<br />
BOOK 3
Drawing to Scale – Enlarging<br />
Section 2<br />
7<br />
6<br />
5<br />
The grid method can be used to copy and enlarge<br />
a map. The lines in each square of the smaller<br />
grid are copied exactly on to the larger grid.<br />
4<br />
3<br />
1. Use the grid of larger squares to copy and enlarge the map of Italy.<br />
7<br />
6<br />
5<br />
4<br />
3<br />
2<br />
2<br />
1<br />
A B C D E F G<br />
Review sample<br />
1<br />
A B C D E F G<br />
2. What effect would it have on the scale of the enlarged map if rectangles were used instead of squares?<br />
Prim-Ed Publishing – www.prim-ed.com 43 978-1-84654-917-5 <strong>Using</strong> <strong>Maps</strong><br />
BOOK 3
Section 2<br />
Drawing to Scale – Reducing<br />
The grid method can also be used to reduce the size of a map. The lines in each square of the larger grid are<br />
copied exactly on to the smaller grid.<br />
5<br />
1. Use the grid squares to draw a<br />
smaller-scale grid map of Australia.<br />
2. Before you copy the map to this<br />
grid, predict how you think it<br />
will look.<br />
4<br />
3<br />
2<br />
1<br />
A B C D E F G<br />
5<br />
4<br />
3<br />
2<br />
1<br />
5<br />
4<br />
3<br />
A B C D E F G<br />
Review sample<br />
2<br />
1<br />
A B C D E F G<br />
<strong>Using</strong> <strong>Maps</strong> 978-1-84654-917-5 44 Prim-Ed Publishing – www.prim-ed.com<br />
BOOK 3
Cartesian Coordinate System – One Quadrant<br />
Section 2<br />
The Cartesian coordinate system was developed by a mathematician named Rene Descartes, who was known<br />
as Cartesius, which is where the name came from. Cartesian coordinates use grid squares and numbers along<br />
an x axis (horizontal) and y axis (vertical) to pinpoint a place or feature on a graph, plane or map. They can<br />
also use positive and negative numbers.<br />
y<br />
axis<br />
10<br />
9<br />
8<br />
7<br />
6<br />
5<br />
4<br />
3<br />
2<br />
1<br />
D<br />
A<br />
0 1 2 3 4 5 6 7 8 9 10 11 12 13 14 15<br />
1. Look at the graph above and write the Cartesian coordinates for each of the letters. Write the x axis<br />
number before the y axis.<br />
(a) A = (b) P = (c) S =<br />
(d) T = (e) E = (f) D =<br />
2. Add the following letters to these coordinates on the graph/plane above.<br />
S<br />
(a) C = (3, 5) (b) N = (12, 4) (c) O = (13, 3) (d) R = (1, 8)<br />
3. Write as many words as you can using all the letters on the Cartesian plane. Share them with a partner.<br />
E<br />
Review sample<br />
P<br />
T<br />
x<br />
axis<br />
Prim-Ed Publishing – www.prim-ed.com 45 978-1-84654-917-5 <strong>Using</strong> <strong>Maps</strong><br />
BOOK 3
Section 2<br />
Cartesian Coordinate System – Four Quadrants<br />
A Cartesian plane can have four quadrants (quad means ‘four’). When this happens it uses positive and<br />
negative numbers and, unlike a number line, can go up and down as well as left and right. The horizontal<br />
number (x axis) is still written before the vertical number (y axis).<br />
Q2 Top left<br />
5<br />
Q1 Top right<br />
4<br />
– 5 – 4 – 3 – 2 – 1 0<br />
Q4 Bottom left<br />
1. Looking at the Cartesian plane above, what would you find at these coordinates? Draw the symbol and<br />
write the quadrant number.<br />
(a) (2, –1) (b) (–5, –5)<br />
(c) (3, 4) (d) (–1, 4)<br />
2. Add these symbols to these coordinates.<br />
(a) A rectangle in quadrant 3 (4, –3) (b) A triangle in quadrant 1 (4, 2)<br />
(c) A semi-circle in quadrant 4 (–1, –1) (d) A pentagon in quadrant 2 (–4, 2)<br />
3. Draw dots at these coordinates.<br />
(a) (0, 5) (b) (2, 2) (c) (3, 0) (d) (5, –2) (e) (3, –2)<br />
(f) (1, –2) (g) (–1, –2) (h) (–3, –2) (i) (–5, –2) (j) (–4, –1)<br />
(k) (–3, 0) (l) (–1, 3) (m) (0, 5)<br />
4. Join the dots of the coordinates in question 3. What shape have you drawn?<br />
– 1<br />
– 2<br />
– 3<br />
– 4<br />
– 5<br />
3<br />
2<br />
1<br />
1 2 3 4 5<br />
Q3 Bottom right<br />
Review sample<br />
<strong>Using</strong> <strong>Maps</strong> 978-1-84654-917-5 46 Prim-Ed Publishing – www.prim-ed.com<br />
BOOK 3
Cartesian Plane: Island Map – 1<br />
Section 2<br />
y<br />
axis<br />
10<br />
0 10 20 30 40 km<br />
Scale: 1.5 cm = 10 km<br />
9<br />
8<br />
−6 −5 −4 −3 −2 −1<br />
−1<br />
−2<br />
−3<br />
−4<br />
−5<br />
−6<br />
7<br />
6<br />
5<br />
4<br />
3<br />
2<br />
1<br />
0, 0<br />
1 2 3 4 5 6<br />
Review sample<br />
x<br />
axis<br />
−7<br />
−8<br />
−9<br />
−10<br />
Prim-Ed Publishing – www.prim-ed.com 47 978-1-84654-917-5 <strong>Using</strong> <strong>Maps</strong><br />
BOOK 3
Section 2<br />
Cartesian Plane: Island Map – 2<br />
You will need a copy of Cartesian Plane: Island Map – 1.<br />
1. What are the coordinates for each feature?<br />
(a) Palm trees: (b) Huts:<br />
(c) Caves: (d) Lakes:<br />
2. What features are at each set of coordinates?<br />
(a) (6, –3): (b) (–4, –10):<br />
(c) (4, –5) and (5, –4): (d) (0, 0), (–1, 1) and (–1, –1):<br />
3. Add the features to the map at the given coordinates.<br />
(a) A camp fire at (5, –3) (b) A tent at (–2, –7)<br />
(c) A treasure chest at (–6, –2) (d) A pond at (5, 3)<br />
4. (a) Starting at the huts, plot a path of coordinates around the island, visiting features along the way.<br />
(b) Calculate the distance between each feature along the way.<br />
(c) Calculate the total distance covered.<br />
Feature Coordinates Distance<br />
Review sample<br />
<strong>Using</strong> <strong>Maps</strong> 978-1-84654-917-5 48 Prim-Ed Publishing – www.prim-ed.com<br />
BOOK 3
Cartesian Plane: Map of Victoria – 1<br />
Section 2<br />
Victoria is a state in south-east Australia.<br />
Map of VICTORIA<br />
4<br />
3<br />
2<br />
Mt Bogong<br />
1<br />
–9 –8 –7 –6 –5 –4 –3 –2 –1 0 1 2 3 4 5 6 7 8<br />
Mt William<br />
Mt Macedon<br />
–1<br />
–2<br />
Melbourne<br />
–3<br />
–4<br />
–5<br />
–6<br />
8<br />
7<br />
6<br />
5<br />
Mt Buller<br />
Mt Hotham<br />
Mt Baw Baw<br />
Review sample<br />
LEGEND<br />
state capital<br />
other towns / cities<br />
state border<br />
coastline<br />
mountains<br />
Prim-Ed Publishing – www.prim-ed.com 49 978-1-84654-917-5 <strong>Using</strong> <strong>Maps</strong><br />
BOOK 3
Section 2<br />
Cartesian Plane: Map of Victoria – 2<br />
You will need a copy of Cartesian Plane: Map of Victoria – 1.<br />
1. Use the map of Victoria to answer each question.<br />
(a)<br />
(b)<br />
What is the capital city of Victoria?<br />
What are its coordinates?<br />
2. Add the names of these towns and cities to the map of Victoria using their coordinates.<br />
(a) Mildura: (–7, 7) (b) Shepparton: (0, 2) (c) Wodonga: (2, 2)<br />
(d) Geelong: (–2, –2) (e) Bendigo: (–3, 1) (f) Warrnambool: (–6, –3)<br />
(g) Hamilton: (–7, –1) (h) Lakes Entrance: (4, –2) (i) Swan Hill: (–4, 4)<br />
3. List the coordinates for each mountain.<br />
(a) Mount Bogong: (b) Mount Buller:<br />
(c) Mount Hotham: (d) Mount Macedon:<br />
(e) Mount William: (f) Mount Baw Baw:<br />
4. Research and add to the map, one of Victoria’s lakes.<br />
(a)<br />
(b)<br />
(c)<br />
What is the name of the lake?<br />
What are the lake’s coordinates?<br />
What is the closest city to the lake?<br />
5. Starting at Melbourne, use coordinates to plot two separate routes to another town or city in Victoria,<br />
passing at least one mountain. Give your instructions to friends to follow.<br />
Route one<br />
Route two<br />
Review sample<br />
Mountain(s) passed:<br />
Mountain(s) passed:<br />
Destination:<br />
How would you rate your instructions? Mark you score on the line.<br />
0 10<br />
Poor<br />
Excellent<br />
<strong>Using</strong> <strong>Maps</strong> 978-1-84654-917-5 50 Prim-Ed Publishing – www.prim-ed.com<br />
BOOK 3
Physical Features: Asia – 1<br />
Caspian Sea<br />
Arabian<br />
Desert<br />
Aral Sea<br />
Karakum<br />
Desert<br />
Lake Balkhash<br />
K2<br />
Kangchenjunga<br />
Everest<br />
Lake Taymyr<br />
Lake Baikal<br />
Gobi Desert<br />
Huang He River<br />
Yangtze River<br />
Mekong River<br />
Lake Khanka<br />
LEGEND<br />
Desert<br />
Peak<br />
River<br />
Lake<br />
Section 2<br />
Review sample<br />
Prim-Ed Publishing – www.prim-ed.com 51 978-1-84654-917-5 <strong>Using</strong> <strong>Maps</strong><br />
BOOK 3
Section 2<br />
Physical Features: Asia – 2<br />
The physical geography of Asia is very diverse. This continent is home to the world’s highest mountain range,<br />
‘the roof of the world’, and the world’s lowest sea. It has forests, deserts, tundra, volcanoes, and many lakes<br />
and rivers.<br />
You will need a copy of Physical Features: Asia – 1 and access to an atlas or the Internet.<br />
1. Complete the table about the top three of each physical feature.<br />
Largest<br />
deserts<br />
Highest<br />
peaks<br />
Longest<br />
rivers<br />
Largest<br />
lakes<br />
Name<br />
Area, km 2<br />
Name<br />
Height, m<br />
Name<br />
Length,<br />
km<br />
Name<br />
Area, km 2<br />
1 2 3<br />
2. Choose a colour to mark each feature on your map of Asia. Add each symbol to the legend.<br />
3. Research the location of some of Asia’s largest mountain ranges to mark on your map.<br />
4. (a) Which two of the five main lines of latitude pass through Asia? Mark them on your map.<br />
(b)<br />
Review sample<br />
Between which lines of longitude does Asia lie? Mark them on your map.<br />
5. The Dead Sea lies between Jordan and Israel. Mark it on your map. Research to find three interesting<br />
facts about the Dead Sea.<br />
•<br />
•<br />
•<br />
<strong>Using</strong> <strong>Maps</strong> 978-1-84654-917-5 52 Prim-Ed Publishing – www.prim-ed.com<br />
BOOK 3
Physical Features: Europe – 1 Section 2<br />
Review sample<br />
Prim-Ed Publishing – www.prim-ed.com 53 978-1-84654-917-5 <strong>Using</strong> <strong>Maps</strong><br />
BOOK 3
Section 2<br />
Physical Features: Europe – 2<br />
The landscape of Europe is wide and varied. Its location and physical features provide a range of climates with<br />
great seasonal variations.<br />
You will need a copy of Physical Features: Europe – 1 and access to an atlas or the Internet.<br />
1. Write some research questions to ask about each aspect of Europe’s physical geography.<br />
Aspect<br />
Questions<br />
Location<br />
Land<br />
Water<br />
Mountains<br />
Climate and<br />
weather<br />
Seasons<br />
2. List the resources you will use to find information to answer your questions.<br />
3. Add the information you have learned to your map of Europe. Include a title, a legend and a compass<br />
rose.<br />
4. Write a fast fact you have learned about each aspect.<br />
Location Land Water<br />
Review sample<br />
Mountains Climate and weather Seasons<br />
<strong>Using</strong> <strong>Maps</strong> 978-1-84654-917-5 54 Prim-Ed Publishing – www.prim-ed.com<br />
BOOK 3
World Temperatures – 1<br />
Section 2<br />
MAP A<br />
30 ºC<br />
20 to 30 ºC<br />
10 to 20 ºC<br />
0 to 10 ºC<br />
–10 to 0 ºC<br />
–10 ºC<br />
MAP B<br />
30 ºC<br />
20 to 30 ºC<br />
10 to 20 ºC<br />
0 to 10 ºC<br />
N<br />
Hugo Stiglitz<br />
Review sample<br />
–10 to 0 ºC<br />
–10 ºC<br />
N<br />
Prim-Ed Publishing – www.prim-ed.com 55 978-1-84654-917-5 <strong>Using</strong> <strong>Maps</strong><br />
BOOK 3
Section 2<br />
World Temperatures – 2<br />
At any time of the year, different places across the globe experience different average daily temperatures. This<br />
information can be shown on a map.<br />
You will need a copy of World Temperatures – 1. The two maps show the average daily temperature ranges for<br />
January and July. The legend of each map explains the meaning of the different shaded areas on the map.<br />
1. (a) Which map represents which month?<br />
Map A<br />
Map B<br />
(b)<br />
Explain your answers for (a).<br />
2. With reference to the major lines of latitude, describe the difference in temperature for January and July,<br />
for different places in the world.<br />
3. Compare items of clothing and footwear you might need if you lived in each country all year.<br />
Sri Lanka<br />
Similar clothes<br />
Different clothes<br />
Review sample<br />
France<br />
<strong>Using</strong> <strong>Maps</strong> 978-1-84654-917-5 56 Prim-Ed Publishing – www.prim-ed.com<br />
BOOK 3
World Time Zones – 1<br />
Section 2<br />
0º<br />
180º<br />
0100 0200 0300 0400 0500 0600 0700 0800 0900 1000 1100 12 00 1300 1400 1500 1600 1700 1800 1900 2000 2100 2200 2300 24 00<br />
SUN<br />
NORTH PACIFIC<br />
OCEAN<br />
SOUTH PACIFIC<br />
OCEAN<br />
NORTH ATLANTIC<br />
OCEAN<br />
Review sample<br />
SOUTH ATLANTIC<br />
OCEAN<br />
INDIAN OCEAN<br />
SUN<br />
0100 0200 0300 0400 0500 0600 0700 0800 0900 1000 1100 12 00 1300 1400 1500 1600 1700 1800 1900 2000 2100 2200 2300 24 00<br />
Prime meridian 0º International Date Line 180º<br />
Prim-Ed Publishing – www.prim-ed.com 57 978-1-84654-917-5 <strong>Using</strong> <strong>Maps</strong><br />
BOOK 3
Section 2<br />
World Time Zones – 2<br />
The world today operates on the 24-hour standard time known as Coordinated Universal Time (UTC). The line<br />
of longitude at 0º passes through a place called Greenwich, near London in the UK. This line is known as the<br />
Prime meridian and it is from here that all times are based. The International Date Line is the line of longitude<br />
at 180º. It passes through the Pacific Ocean on the opposite side of the world from Greenwich.<br />
You will need a copy of World Time Zones – 1 and access to the Internet.<br />
1. As Earth spins in a counter-clockwise direction, which half of the globe is ahead, in time, of Greenwich<br />
and which half is behind?<br />
(a) Western Europe, Africa, Asia, Australia Ahead or Behind<br />
(b) Greenland, North America, South America Ahead or Behind<br />
2. All lines of longitude, apart from 0º and 180º, are labelled E for east or W for west. Name the lines of<br />
longitude passing close to each city and write ahead or behind UTC.<br />
(a) Toronto: Canada (b) Tokyo: Japan<br />
(d) Santiago, Chile (c) Colombo: Sri Lanka<br />
(e) Anchorage: Alaska, USA (f) Madrid: Spain<br />
3. People who travel by air talk about ‘gaining’ and ‘losing’ time.<br />
(a) To ‘gain’ time, you travel east or west (b) To ‘lose’ time, you travel east or west<br />
(c)<br />
Does this remain true if the International Date Line is crossed?<br />
4. From your closest airport, plan a journey across different time zones to some of the world’s major cities.<br />
City Local time, 24-hr clock Hours + or – UTC<br />
Review sample<br />
5. The Prime meridian is shown on a map as a straight line but the International Date Line has a number<br />
of bends in it. Explain why you think this is.<br />
6. (a) Look at a map of world time zones on the Internet. What do you notice about the time zones of<br />
Russia, Australia and the USA compared with China?<br />
(b)<br />
Discuss the effect this may have on the lives of people in China.<br />
<strong>Using</strong> <strong>Maps</strong> 978-1-84654-917-5 58 Prim-Ed Publishing – www.prim-ed.com<br />
BOOK 3
Country Population and Density – 1<br />
Section 2<br />
The population of a country does not give a true picture of how crowded the country may be, because some<br />
countries have a bigger area than others. A more accurate statistic is the population density, population<br />
divided by area.<br />
1. Calculate the population density to the nearest whole<br />
number of each country and add it to the table.<br />
One<br />
= 100,000,000 people<br />
Country Approximate population Area km 2 Density number/km 2<br />
Australia 7,687,000<br />
United Kingdom 244,000<br />
Japan 378,000<br />
Russia 17,075,000<br />
Bangladesh 148,000<br />
Nigeria 924,000<br />
Pakistan 796,000<br />
Brazil 8,516,000<br />
Indonesia 1,905,000<br />
USA 9,834,000<br />
India 3,288,000<br />
China 9,597,000<br />
2. The legend shows how countries with similar population densities could be grouped. Add the countries<br />
from the table to the correct group in the legend.<br />
Population density number/ km 2 Symbol or colour Countries<br />
(a) Less than 100<br />
(b) 100–200<br />
(c) 200–300<br />
(d) 300–400<br />
(e) 400–500<br />
Review sample<br />
(f) Greater than 500<br />
Prim-Ed Publishing – www.prim-ed.com 59 978-1-84654-917-5 <strong>Using</strong> <strong>Maps</strong><br />
BOOK 3
Section 2<br />
Country Population and Density – 2<br />
The population density of a country gives a clue about how much of the land is suitable for human habitation.<br />
You will need access to an atlas or the Internet.<br />
1. Look at a variety of world maps; e.g. physical, climatic, annual temperature range, precipitation and<br />
natural vegetation. Compare them with a population density map.<br />
(a)<br />
(b)<br />
(c)<br />
Write three research questions you might ask to discover why the main areas of high population<br />
density are where they are.<br />
Write key words and phrases you find in researching each question.<br />
Write a full answer to each question, giving examples and explanations.<br />
Question Key words/phrases Answer<br />
Review sample<br />
<strong>Using</strong> <strong>Maps</strong> 978-1-84654-917-5 60 Prim-Ed Publishing – www.prim-ed.com<br />
BOOK 3
World Agriculture and Resources – 1 Section 2<br />
Review sample<br />
Prim-Ed Publishing – www.prim-ed.com 61 978-1-84654-917-5 <strong>Using</strong> <strong>Maps</strong><br />
BOOK 3
Section 2<br />
World Agriculture and Resources – 2<br />
Different areas of the globe are rich in different natural resources and have different climates to support<br />
different forms of agriculture.<br />
You will need a copy of World Agriculture and Resources – 1 and access to the Internet.<br />
1. (a) For the legend, design a symbol for each natural resource and agricultural product.<br />
(b)<br />
Research to find the top five producers of each resource and agricultural product.<br />
(c)<br />
<strong>Using</strong> your legend symbols, mark on the outline world map countries where each resource is mined<br />
or farmed. Add the legend to the map and a suitable title.<br />
Natural resource or<br />
agricultural product<br />
wool<br />
leather<br />
rice<br />
coffee<br />
tea<br />
wheat<br />
tobacco<br />
oil<br />
gold<br />
diamonds<br />
Symbol<br />
Countries where resource is mined or farmed<br />
Review sample<br />
2. What information does your completed map give you about the countries where the resources are<br />
mined or farmed?<br />
<strong>Using</strong> <strong>Maps</strong> 978-1-84654-917-5 62 Prim-Ed Publishing – www.prim-ed.com<br />
BOOK 3
World Markets – 1 Section 2<br />
Review sample<br />
Prim-Ed Publishing – www.prim-ed.com 63 978-1-84654-917-5 <strong>Using</strong> <strong>Maps</strong><br />
BOOK 3
Section 2<br />
World Markets – 2<br />
Natural resources that are mined, and produce that is farmed or manufactured in one country is exported to<br />
markets all over the world. Countries import goods from different places so wherever you live in the world, you<br />
have access to goods from across the globe.<br />
You will need a copy of World Markets – 1 and access to the Internet.<br />
1. Motor vehicles are imported from a number of different countries. Research the names of 15 makes of<br />
car you see in your area and where they come from. Draw the symbol for each make.<br />
Make Symbol Country imported from<br />
Review sample<br />
2. Put this information on the outline world map with arrows to indicate the exports to your country. Add a<br />
legend and a suitable title.<br />
3. Explain the information your map gives about where in the world motor car manufacturing occurs.<br />
<strong>Using</strong> <strong>Maps</strong> 978-1-84654-917-5 64 Prim-Ed Publishing – www.prim-ed.com<br />
BOOK 3
World Pollution Index – 1 Section 2<br />
Review sample<br />
Prim-Ed Publishing – www.prim-ed.com 65 978-1-84654-917-5 <strong>Using</strong> <strong>Maps</strong><br />
BOOK 3
Section 2<br />
World Pollution Index – 2<br />
As the world population has grown, so has the need for more food and the market for manufactured goods and<br />
energy. This growth comes at a cost to the environment—pollution in its many forms. Although attempts may<br />
be made to reduce pollution, the problem still remains.<br />
The air quality of cities around the world are tested and given a pollution rating known as the Pollution index.<br />
You will need a copy of World Pollution Index – 1 and access to the Internet.<br />
1. (a) Type ‘Pollution index by city’ into an Internet search engine to find the 15 most and least air polluted<br />
cities in the world.<br />
(b)<br />
(c)<br />
Design a way to show the rank of each city in each category; e.g. red numbers for most polluted,<br />
green for least polluted.<br />
Mark each city on the outline world map.<br />
Most polluted cities Rank and symbol Least polluted cities Rank and symbol<br />
Review sample<br />
2. Explain what your completed map tells you about pollution across the globe.<br />
<strong>Using</strong> <strong>Maps</strong> 978-1-84654-917-5 66 Prim-Ed Publishing – www.prim-ed.com<br />
BOOK 3
Australian Population and Cultural Diversity – 1 Section 2<br />
Review sample<br />
Prim-Ed Publishing – www.prim-ed.com 67 978-1-84654-917-5 <strong>Using</strong> <strong>Maps</strong><br />
BOOK 3
Section 2<br />
Australian Population and Cultural Diversity – 2<br />
European explorers first sighted the Australian continent in 1606, but the Aboriginal people had arrived here<br />
about 50,000 years earlier. It is believed the total population of Indigenous people before the arrival of the<br />
First Fleet in 1778 was barely 500,000. In less than 250 years, migrants from all over the globe have raised<br />
the population to over 24,000,000.<br />
You will need a copy of Australian Population and Cultural Diversity – 1 and access to the Internet.<br />
1. (a) Research the nationalities of the different European explorers who visited different parts of Australia<br />
before British settlement. Include dates of where they landed or sighted land.<br />
(b)<br />
Research the nationalities of the different waves of migrants to Australia since the First Fleet. Include<br />
where they settled and the approximate time periods in which they came.<br />
Nationality Time period Location<br />
Review sample<br />
2. Add the information you have discovered to the outline world map. Use arrows to indicate where the<br />
explorers and migrants came from. Give the map a title and a legend.<br />
3. Use your map as a resource to help you explain to someone about the discovery and settlement of<br />
Australia.<br />
<strong>Using</strong> <strong>Maps</strong> 978-1-84654-917-5 68 Prim-Ed Publishing – www.prim-ed.com<br />
BOOK 3
Name Assessment 1 Section 2<br />
Cartesian Plane Park Map<br />
y axis<br />
7<br />
Flying fox<br />
6<br />
Climbing net<br />
Monkey bars<br />
5<br />
Sandpit<br />
4<br />
3<br />
Fort<br />
Slide<br />
Balance beam<br />
2<br />
Swing<br />
1<br />
– 8 – 7 – 6 – 5 – 4 – 3 – 2 – 1 0, 0 1 2 3 4 5 6 7 8<br />
Push ups<br />
Sit ups<br />
0 10 20 30 40 m<br />
Running track<br />
Chin ups<br />
1. Looking at the adventure park above, what would you find at these coordinates?<br />
(a) (4, 3), (4,4): (b) (–7, 4), (–7, 5), (–5, 4), (–5, 5):<br />
(c) (7, –2): (d) (5, 2), (6, 2), (7,2):<br />
2. What are the coordinates for these park features?<br />
(a) sit ups: (b) balance beam:<br />
(c) monkey bars: (d) BBQ:<br />
3. Add a tap symbol to each of these coordinates: (7, 4), (5, –4), (–5, –3) and (–1, 4).<br />
4. Plot two more seats where you think they are needed.<br />
5. Use the map scale to work out the real length of these features.<br />
(a) flying fox: (b) running track: (c) balance beam: (d) slide:<br />
– 1<br />
– 2<br />
– 3<br />
– 4<br />
– 5<br />
– 6<br />
– 7<br />
Picnic<br />
area<br />
m m m m<br />
6. (a) Choose a starting point and plot a path around the adventure park, visiting features along the way.<br />
Seat<br />
Toilets<br />
Review sample<br />
T<br />
BBQ<br />
x<br />
axis<br />
(b)<br />
Give your instructions to a partner to follow and rate how good they were.<br />
confusing<br />
very clear<br />
Prim-Ed Publishing – www.prim-ed.com 69 978-1-84654-917-5 <strong>Using</strong> <strong>Maps</strong><br />
BOOK 3
Section 2<br />
Assessment 2<br />
Name<br />
<strong>Using</strong> Scales<br />
1. Complete the missing information for each scale.<br />
Written Ratio Graphic<br />
(a) 1 cm = 1 km 1:100,000<br />
(b) 1:50,000<br />
(c)<br />
(d)<br />
1 cm = 0.75 km<br />
2. Measure and calculate the real distance between each town with the given scale.<br />
Harper<br />
Glamis<br />
(a) Hull to Kent: 1 cm = 0.5 km<br />
(b) Glamis to Harper: 1: 500,000<br />
(c) Harper to Hull 1 cm = 1 km<br />
(d) Glamis to Kent 1: 75<br />
3. An area to be mapped measures 4 metres by 5 metres. Write the measurements for a map of the area<br />
drawn at each scale.<br />
(a)<br />
(b)<br />
(c)<br />
1 cm = 1 m<br />
1 cm = 2 m<br />
1 cm = 0.5 m<br />
Hull<br />
Kent<br />
4. Circle the scale which would allow the cartographer to add the most detail.<br />
(a) 1 cm = 1 m (b) 1 cm = 2 m (c) 1 cm = 0.5 m<br />
5. Explain the link between scale and detail.<br />
Harper<br />
0<br />
Hull<br />
1 km<br />
1 2 3 4 cm<br />
0.25<br />
0.5 0.75<br />
Glamis<br />
Review sample<br />
Kent<br />
<strong>Using</strong> <strong>Maps</strong> 978-1-84654-917-5 70 Prim-Ed Publishing – www.prim-ed.com<br />
BOOK 3
Name Assessment 3 Section 2<br />
1. (a) Give each rainfall band a different<br />
shade of colour.<br />
Legend of rainfall mm<br />
0 to 20<br />
21 to 40<br />
41 to 60<br />
61 to 80<br />
81 to 100<br />
101 to 120<br />
more than 120<br />
(b) Use the legend to colour the map<br />
of Svenland correctly.<br />
Average monthly rainfall for Svenland<br />
Region Abbreviation Rainfall mm<br />
Urj UJ 65<br />
Glaurus GS 100<br />
Zaug ZG 80<br />
Argau AU 35<br />
Vaudor VR 110<br />
Jura JA 45<br />
Baden BN 70<br />
From a Table to a Map<br />
2. Suggest three groups of people who might study a map of rainfall. Explain why they would be interested.<br />
Groups of interested people<br />
VR<br />
ZG<br />
Svenland<br />
GS<br />
Reasons for interest<br />
BN<br />
AU<br />
Review sample<br />
UJ<br />
JA<br />
Prim-Ed Publishing – www.prim-ed.com 71 978-1-84654-917-5 <strong>Using</strong> <strong>Maps</strong><br />
BOOK 3
E<br />
Section 2<br />
Assessment 4<br />
1. (a) What information on<br />
the map tells the<br />
hemisphere in which<br />
Canada lies?<br />
W<br />
NW<br />
N<br />
NE<br />
Name<br />
Population and Location<br />
Map of Canada<br />
80° N 70° N<br />
LEGEND<br />
MOUNTAINS<br />
LAKE<br />
ARCTIC<br />
CIRCLE<br />
SW<br />
S<br />
SE<br />
NATIONAL CAPITAL<br />
<strong>PR</strong>OVINCE / TERRITORY CAPITAL<br />
ALBERTA<br />
3,750,000<br />
<strong>PR</strong>OVINCE / TERRITORY NAME AND POPULATION<br />
GREENLAND<br />
60° N<br />
(b)<br />
(c)<br />
Describe the location<br />
of Canada with<br />
reference to its<br />
proximity to the<br />
equator and the poles.<br />
YUKON<br />
TERRITORY<br />
34,000<br />
Whitehorse<br />
BRITISH<br />
COLUMBIA<br />
4,500,000<br />
Victoria<br />
Great<br />
Bear<br />
Lake<br />
NORTHWEST<br />
TERRITORIES<br />
41,500<br />
ALBERTA<br />
3,750,000<br />
Yellowknife<br />
Edmonton<br />
SASKATCHEWAN<br />
1,000,000<br />
Regina<br />
NUNAVUT<br />
32,000<br />
Reindeer<br />
Lake<br />
MANITOBA<br />
1,250,000<br />
ONTARIO<br />
13,000,000<br />
Iqaluit<br />
Toronto<br />
QUEBEC<br />
8,000,000<br />
<strong>PR</strong>INCE EDWARD<br />
NEW<br />
Charlottetown<br />
ISLAND<br />
BRUNSWICK<br />
140,000<br />
750,000<br />
Quebec<br />
Ottawa<br />
Fredericton<br />
NEWFOUNDLAND<br />
AND LABRADOR<br />
500,000<br />
St Johns<br />
Halifax<br />
50° N<br />
40° N<br />
NOVA SCOTIA<br />
1,000,000<br />
Describe the weather and daylight hours you think regions of Canada would experience in winter.<br />
Give reasons for your answer.<br />
2. In different colours, shade each province and territory on the map of Canada.<br />
Review sample<br />
3. (a) Write the names of the provinces/territories in order from what you think have the greatest to least<br />
population density.<br />
(b)<br />
Explain how you made your decision for the list in (a).<br />
<strong>Using</strong> <strong>Maps</strong> 978-1-84654-917-5 72 Prim-Ed Publishing – www.prim-ed.com<br />
BOOK 3
Answers<br />
SECTION 1 ANSWERS<br />
DIFFERENT VIEWS – 2 2<br />
1. (a) 1 (b) 2<br />
(c) 3 (d) 1 and 3<br />
(e) 2 (f) 1<br />
(g) 2<br />
2. (a) 1 ,2, 3 (b) 1, 2, 3<br />
(c) 2 (d) 1<br />
(e) 1, 2, 3<br />
3. so spectators can see close-up<br />
action from parts of the field<br />
that are far away from them<br />
4.–5. Teacher check<br />
IDENTIFYING MAPS – 2 4<br />
1. B – Road or Street map<br />
C – Physical or Natural map<br />
D – Satellite map/image<br />
A – Political map<br />
E – Economic or Resource map<br />
2. Teacher check<br />
CHOOSING MAPS 5<br />
1.–3. Teacher check<br />
USING AN ATLAS 6<br />
1. (a) Wellington<br />
(b) London<br />
(c) Washington DC<br />
(d) Beijing<br />
(e) Rome<br />
(f) Ottawa<br />
(g) Dublin<br />
(h) Moscow<br />
2. (a) Asia 44,579,000<br />
(b) Africa 30,365,000<br />
(c) North America<br />
24,256,000<br />
(d) South America<br />
17,819,000<br />
(e) Antarctica 14,209,000<br />
(f) Europe 9,938,000<br />
(g) Australia/Oceania<br />
7,687,000<br />
3. (a) Arctic 13,986,000<br />
(b) Southern 20,327,000<br />
(c) Indian 73,556,000<br />
(d) Atlantic 106,400,000<br />
(e) Pacific 165,200,000<br />
GRID MAPS:<br />
A ZOO – 2 8<br />
1. (a) pathway<br />
(b) first aid<br />
(c) picnic area<br />
(d) cafe/restaurant<br />
(e) entrance<br />
(f) gift shop<br />
2. (a) penguins<br />
(b) turtles<br />
(c) toilets<br />
(d) meerkats<br />
(e) zebras<br />
(f) kangaroos<br />
3. (a) B1<br />
(b) G8, H8<br />
(c) D12<br />
(d) A6<br />
(e) C10, D10<br />
(f) H11<br />
4.–6. Teacher check<br />
GRID MAPS:<br />
A SCHOOL – 2 10<br />
1. (a) F1 (b) G6, H6<br />
(c) C4, C5 (d) K8, L8<br />
(e) E5, E6 (f) C3<br />
2. (a) car park<br />
(b) staff room<br />
(c) office<br />
(d) hall<br />
3.–5. Teacher check<br />
GRID MAPS:<br />
A CLASSROOM – 2 12<br />
Teacher check<br />
STREET MAPS – 2 14<br />
1. Teacher check<br />
2. (a) fire station<br />
(b) theatre<br />
(c) sports centre<br />
(d) quay<br />
3. (a) A7, B7 (b) E5<br />
(c) I1 (d) D5, E6<br />
4.–6. Teacher check<br />
DIRECTIONAL LANGUAGE 15<br />
1. (a) forward (b) back<br />
(c) south (d) left<br />
(e) north (f) behind<br />
(g) front (h) east<br />
(i) right (j) west<br />
(k) above (l) below<br />
2.–5. Teacher check<br />
A MAP LEGEND 16<br />
1. (a) airport<br />
(b) hospital<br />
(c) medical centre<br />
(d) shopping centre<br />
(e) cycle path<br />
(f) bus station<br />
(g) police station<br />
(h) wheelchair access<br />
2.–3. Teacher check<br />
READING A MAP – 1 17<br />
Teacher check<br />
READING A MAP – 2 18<br />
1. (a) east<br />
(b) north-west<br />
(c) north-west<br />
(d) north/north-west<br />
(e) south-east<br />
(f) south-west<br />
(g) south<br />
(h) east<br />
2.–3. Teacher check<br />
CREATING A MAP 19<br />
Teacher check<br />
Review sample<br />
THE COMPASS ROSE 20<br />
1. (a) south-east<br />
(b) west<br />
(c) north<br />
(d) north-east<br />
(e) south-west<br />
(f) east<br />
2. (a) garage<br />
(b) cow paddock<br />
(c) chicken coop<br />
(d) dam<br />
(e) stables<br />
(f) pool<br />
Prim-Ed Publishing – www.prim-ed.com 73 978-1-84654-917-5 <strong>Using</strong> <strong>Maps</strong><br />
BOOK 3
3.<br />
Answers<br />
Teacher check<br />
MAP FEATURES:<br />
MADAGASCAR – 2 22<br />
1. (a) Title – to say what the map<br />
is about<br />
(b) Legend – to say what the<br />
symbols on the map mean<br />
(c) Scale – to compare the<br />
distance on the map and<br />
the ground<br />
(d) Compass rose – to show<br />
the direction of the land<br />
and features on the map<br />
2. (a) Antananarivo; the legend<br />
shows the symbol for the<br />
capital city<br />
(b) six; the legend shows<br />
the line for the provincial<br />
borders<br />
(c) south-west; the compass<br />
rose shows which way is<br />
north<br />
(d) Tamasina and Tolaria:<br />
810 km, Mahajanga and<br />
Fianarantsoa: 630 km,<br />
Antananarivo and<br />
Antsiranana: 750 km; the<br />
scale shows that each cm<br />
on the map represents<br />
60 km on the ground.<br />
The distance between the<br />
cities in cm on the map<br />
multiplied by 60 equals the<br />
distance between the cities<br />
on the ground.<br />
3. Teacher check<br />
MAP SCALES:<br />
TASMANIA – 2 24<br />
1. (a) 2 (b) 1<br />
(c) 3<br />
2. (a) Map A: 210 km<br />
Map B: 200 km<br />
Map C: 225 km<br />
(b) B<br />
3. (a) 420 km, 245 km, 210 km<br />
(b) 180 km, 120 km, 160 km<br />
(c) 270 km, 285 km, 345 km<br />
4. Teacher check<br />
LATITUDE AND LONGITUDE – 2 26<br />
1. (a) a line of latitude at 0°<br />
(b) a line of longitude at 0°<br />
(c) a line of longitude at 180°<br />
2. Differences – Latitude: parallel<br />
to one another, only the<br />
equator splits the globe in half,<br />
measured north or south of<br />
the equator at 0º; Longitude:<br />
furthest apart at the equator,<br />
closest together at the poles,<br />
they all split the globe in<br />
half, measured east or west<br />
of the Prime meridian at 0º<br />
Similarities – measured in<br />
degrees in relation to a line at<br />
0º, divide the globe into areas<br />
3. Teacher check<br />
4. (a) Argentina<br />
(b) China<br />
(c) Canada<br />
(d) Iran<br />
(e) Australia<br />
(f) USA<br />
HEMISPHERES, TROPICS<br />
AND CIRCLES – 2 28<br />
1. (a)–(b)<br />
0º: the equator; countries may<br />
include Gabon, Republic<br />
of Congo, Democratic<br />
Republic of Congo, Uganda,<br />
Kenya, Somalia, Indonesia,<br />
Ecuador, Colombia, Brazil,<br />
Maldives, Kiribati, Sao Tome<br />
and Principe<br />
23.5º N: Tropic of Cancer;<br />
countries may include<br />
Western Sahara,<br />
Mauritania, Mali, Algeria,<br />
Libya, Egypt, Saudi Arabia,<br />
United Arab Emirates,<br />
Oman, India, Bangladesh,<br />
Myanmar, China, Taiwan,<br />
Mexico, the Bahamas, Niger<br />
23.5º S: Tropic of Capricorn;<br />
countries may include<br />
Namibia, Botswana, South<br />
Africa, Mozambique,<br />
Madagascar, Australia,<br />
Chile, Argentina, Paraguay,<br />
Brazil, French Polynesia,<br />
Tonga<br />
66.5º N: Arctic Circle; countries<br />
may include Norway,<br />
Sweden, Finland, Russia,<br />
USA, Canada, Iceland,<br />
Denmark (Greenland)<br />
66.5º S: Antarctic Circle; passes<br />
through no countries<br />
(c) Teacher check<br />
2. Teacher check<br />
STORMY WEATHER – 2 30<br />
1. Teacher check<br />
2. (a) North-east Pacific and<br />
North Atlantic oceans<br />
(b) Indian, South Pacific and<br />
South Atlantic oceans<br />
(c) North-west Pacific Ocean<br />
3. Teacher check<br />
DESCRIBING LOCATIONS 31<br />
1. (a) Libya, Africa<br />
(b) Sweden, Europe<br />
(c) Canada, North America<br />
(d) China, Asia<br />
(e) Iceland, Europe<br />
(f) Vietnam, Asia<br />
(g) Bolivia, South America<br />
(h) New Zealand, Australia<br />
and Oceania<br />
2. (a) 42º N, 13º E<br />
(b) 35º S, 149º E<br />
(c) 19º N, 99º W<br />
(d) 36º N, 140º E<br />
(e) 33º S, 71º W<br />
3. Teacher check<br />
CONTINENT RESEARCH 32<br />
Teacher check<br />
ASSESSMENT 1:<br />
DIFFERENT TYPES OF MAPS 33<br />
1. (a) physical; natural features<br />
such as mountains, lakes,<br />
rivers, deserts, wetlands; to<br />
plan a hiking trip, to decide<br />
the best place for new<br />
construction<br />
(b) road; transport routes,<br />
constructed features; to<br />
plan a route or calculate<br />
distance between places<br />
(c) political; country, county/<br />
state, territory boundaries;<br />
to compare the area of<br />
different places, to plan a<br />
holiday<br />
(d) resource; spread of<br />
resources within an area;<br />
to choose places to visit or<br />
the location of a mine or<br />
business<br />
Review sample<br />
<strong>Using</strong> <strong>Maps</strong> 978-1-84654-917-5 74 Prim-Ed Publishing – www.prim-ed.com<br />
BOOK 3
ASSESSMENT 2:<br />
READING A MAP 34<br />
ASSESSMENT 3:<br />
LOCATING PLACES 35<br />
Answers<br />
ASSESSMENT 4:<br />
RAINFALL – AUSTRALIA 36<br />
1. (a) title<br />
(b) legend<br />
(c) scale<br />
(d) compass rose<br />
2. (a) 1 cm = 10 km<br />
(b) 393 km<br />
(c) (i) 42 km<br />
(ii) 28 km<br />
(iii) 64 km<br />
3. Angus, as this is the name of<br />
the island and it has more roads<br />
leading to it than the other towns.<br />
4. (a) Arbon<br />
(b) south-west<br />
(c) south/east<br />
SECTION 2 ANSWERS<br />
MAPS AND SCALES – 1 37<br />
Line scale – A line that shows<br />
the distance that is represented,<br />
usually for each centimetre.<br />
Ratio scale – A ratio is used to<br />
represent the scale.<br />
Written scale – The scale amount<br />
is written to tell us what each<br />
centimetre represents.<br />
MAPS AND SCALES – 2 38<br />
1. a line scale<br />
2. (a) 3.5 cm, 70 km<br />
(b) 4 cm, 80 km<br />
(c) 5 cm, 100 km<br />
(d) 5 cm, 100 km<br />
(e) 5.5 cm, 110 km<br />
(f) 5.5 cm, 110 km<br />
3. (a) Hobart: sheltered bay away<br />
from wilder weather of west<br />
coast<br />
(b) Launceston: head of river,<br />
important when river transport<br />
brought supplies inland<br />
(c) Devonport: on the coast<br />
with close links to mainland<br />
Australia<br />
4. (a) Furneaux Islands<br />
(b) Bass Strait<br />
5. Teacher check<br />
1. The lines of latitude are marked<br />
are labelled in degrees north.<br />
2. (a) Iceland, Ireland, Portugal,<br />
Spain, United Kingdom<br />
(b) 10ºE<br />
(c) Norway, Sweden, Finland,<br />
Russia, Iceland<br />
(d) The cities are all close to<br />
the line of latitude 50º North<br />
and so are about the same<br />
distance from the equator.<br />
3. (a) 40º & 50º N; 0º & 10º W<br />
(b) 40º & 50º N; 0º & 10º E<br />
(c) 50º & 60º N; 20º & 30º E<br />
(d) 40º & 50º N; 10º & 20º E<br />
(e) 50º & 60º N; 0º & 10º W<br />
(f) 50º & 60º N; 20º & 30º E<br />
(g) 50º & 60º N; 30º & 40º E<br />
(h) 40º & 50º N; 20º & 30º E<br />
USING SCALE AND<br />
DIRECTION – 2 40<br />
1. (b) 1 cm = 5 m<br />
2. (a) 375 m 2 (b) 412.5 m 2 (c)<br />
312.5 m 2 (d) 112.5 m 2<br />
3. (a) Measure the path on the<br />
map in cm then multiply by<br />
5 to give the true distance in<br />
metres.<br />
(b) 530 m<br />
4. (a) south-east<br />
(b) west<br />
(c) north-east<br />
(d) east<br />
5. (a) 117.5 m, NW<br />
(b) 20 m, N<br />
(c) 27.5 m, NE<br />
(d) 47.5 m, SE<br />
6. Mike: 122.5 m<br />
Geoffrey: 117.5 m<br />
Mike walked further.<br />
7. cricket, basketball, netball and<br />
tennis in the morning, swimming<br />
in the afternoon. The sun rises<br />
in the east and sets in the west<br />
so to avoid full sun, play sports<br />
situated on the west side in the<br />
morning and on the east side in<br />
the afternoon.<br />
1. The lines of latitude are labelled<br />
degrees south.<br />
2. (a) The Great Dividing Range<br />
mountains<br />
(b) It is a small island so even the<br />
centre is relatively close to the<br />
coast and it has mountains in<br />
the centre.<br />
3. Tropical regions: more rainfall<br />
– from 400 mm to 1,600 mm<br />
per year; Temperate regions: less<br />
rainfall – from 0 to 800 mm per<br />
year<br />
4. It is very far from the coast and<br />
has no mountains.<br />
DRAWING A MAP<br />
TO SCALE – 1 & 2 41–42<br />
Teacher check<br />
DRAWING TO SCALE –<br />
ENLARGING 43<br />
1. Teacher check<br />
2. The enlarged map would not be to<br />
scale. It would be distorted, either<br />
too wide or too long.<br />
DRAWING TO SCALE –<br />
REDUCING 44<br />
1. Teacher check<br />
Review sample<br />
2. It will be too wide.<br />
CARTESIAN COORDINATE<br />
SYSTEM – ONE QUADRANT 45<br />
1. (a) (4, 2)<br />
(b) (11, 7)<br />
(c) (6, 1)<br />
(d) (14, 9)<br />
(e) (8, 10)<br />
(f) (2, 5)<br />
2.–3. Teacher check<br />
Prim-Ed Publishing – www.prim-ed.com 75 978-1-84654-917-5 <strong>Using</strong> <strong>Maps</strong><br />
BOOK 3
Answers<br />
CARTESIAN COORDINATE<br />
SYSTEM – FOUR QUADRANTS 46<br />
1. (a) Q3<br />
(b) Q4<br />
(c) Q1<br />
(d) Q2<br />
2.–3. Teacher check<br />
4. triangle<br />
CARTESIAN PLANE:<br />
ISLAND MAP – 2 48<br />
1. (a) (–1,10) (–1,9) (–2,10)<br />
(–3,8) (–5,9)<br />
(b) (5,4) (5,6) (4,4) (4,6)<br />
(c) (–3,–6) (–4,–6) (–5,–6)<br />
(d) (3,–5) (3,–6)<br />
2. (a) waterfall<br />
(b) boat<br />
(c) river<br />
(d) mountains<br />
3.–4. Teacher check<br />
CARTESIAN PLANE:<br />
MAP OF VICTORIA – 2 50<br />
1. (a) Melbourne<br />
(b) (–1, –2)<br />
2. Teacher check<br />
3. (a) (3, 1) (b) (1, –1)<br />
(c) (2, 0) (d) (–3, –1)<br />
(e) (–6, 0) (f) (1, –2)<br />
4.–5. Teacher check<br />
PHYSICAL FEATURES: ASIA – 2 52<br />
1. Deserts: Arabian, 2,330,000;<br />
Gobi, 1,300,000;<br />
Karakum, 350,000;<br />
Peaks: Everest, 8,850;<br />
K2, 8,611;<br />
Kangchenjunga, 8,598;<br />
Rivers: Yangtze, 6,301;<br />
Huang He (Yellow), 5,464;<br />
Mekong, 4,350;<br />
Lakes: Caspian Sea, 371,000;<br />
Baikal, 30,500;<br />
Balkhash, 17,000<br />
2.–3. Teacher check<br />
4. (a) Tropic of Cancer, Equator<br />
(b) 30º E and 180º<br />
5. Teacher check<br />
PHYSICAL FEATURES:<br />
EUROPE – 2 54<br />
Teacher check<br />
WORLD TEMPERATURES – 2 56<br />
1. (a) Map A – January<br />
Map B – July<br />
(b) Map A shows colder<br />
temperatures in the<br />
northern hemisphere and<br />
hotter temperatures in<br />
the southern hemisphere<br />
than Map B. In January, it<br />
is winter in the northern<br />
hemisphere and<br />
summer in the southern<br />
hemisphere, so Map A<br />
must be January and<br />
Map B July.<br />
2.–3. Teacher check<br />
WORLD TIME ZONES – 2 58<br />
1. (a) ahead (b) behind<br />
2. (a) 80º W behind<br />
(b) 140º E ahead<br />
(c) 70º W behind<br />
(d) 80º E ahead<br />
(e) 150º W behind<br />
(f) 5º E ahead<br />
3. (a) west (b) east<br />
(c) No, crossing the date line<br />
reverses the result.<br />
4. Teacher check<br />
5. It passes around some islands<br />
so they are in the same time<br />
zone as their close neighbours.<br />
6. (a) Russia, Australia, the<br />
USA and China all span<br />
a number of lines of<br />
longitude but while Russia,<br />
Australia and USA have<br />
many time zones, China<br />
has one time zone for the<br />
whole country.<br />
(b) Teacher check<br />
COUNTRY POPULATION AND<br />
DENSITY – 1 59<br />
1. Australia, 3<br />
UK, 307<br />
Japan, 331<br />
Russia, 9<br />
Bangladesh, 1,013<br />
Nigeria, 189<br />
Pakistan, 251<br />
Brazil, 23<br />
Indonesia, 131<br />
USA, 33<br />
India, 403<br />
China, 146<br />
2. (a) Australia, Russia, Brazil,<br />
USA<br />
(b) Nigeria, Indonesia, China<br />
(c) Pakistan<br />
(d) UK, Japan<br />
(e) India<br />
(f) Bangladesh<br />
COUNTRY POPULATION AND<br />
DENSITY – 2 60<br />
Teacher check<br />
WORLD AGRICULTURE<br />
AND RESOURCES – 2 62<br />
Teacher check<br />
WORLD MARKETS – 2 64<br />
Teacher check<br />
WORLD POLLUTION INDEX – 2 66<br />
Teacher check<br />
AUSTRALIAN POPULATION AND<br />
CULTURAL DIVERSITY – 2 68<br />
Review sample<br />
Teacher check<br />
<strong>Using</strong> <strong>Maps</strong> 978-1-84654-917-5 76 Prim-Ed Publishing – www.prim-ed.com<br />
BOOK 3
Answers<br />
ASSESSMENT 1:<br />
CARTESIAN PLANE PARK MAP 69<br />
1. (a)<br />
slide<br />
(b)<br />
climbing net<br />
(c)<br />
picnic area<br />
(d)<br />
swing<br />
2. (a) (–3, –3)<br />
(b) (–7, 2) and (–5, 2)<br />
(c) (2, 5) and (4, 5)<br />
(d) (7, –4)<br />
3.–4. Teacher check<br />
5. (a) 35 m (b) 70 m<br />
(c) 20 m (d) 10 m<br />
6. Teacher check<br />
ASSESSMENT 2:<br />
USING SCALES: 70<br />
1. (a) Teacher check<br />
(b) 1 cm = 0.5 km and<br />
Teacher check<br />
(c) 1:75,000 and<br />
Teacher check<br />
(d) 1 cm = 0.25 km, 1: 25,000<br />
2. (a) 6.25 km<br />
(b) 40 km<br />
(c) 10.5 km<br />
(d) 7.125 km<br />
3. (a) 4 cm × 5 cm<br />
(b) 2 cm × 2.5 cm<br />
(c) 8 cm × 10 cm<br />
4. (c) 1 cm = 0.5 m<br />
5. The greater the distance on the<br />
ground represented by each<br />
cm on the map, the smaller the<br />
scale and the less detail that<br />
can be shown.<br />
ASSESSMENT 3:<br />
FROM A TABLE TO A MAP 71<br />
Teacher check<br />
ASSESSMENT 4:<br />
POPULATION AND LOCATION 72<br />
1. (a) lines of latitude labelled<br />
north<br />
(b) Its southern border is<br />
about 50º N of the equator<br />
and its northern extreme is<br />
beyond the Arctic Circle.<br />
(c) Answers may include: very<br />
short days close to and<br />
beyond the Arctic Circle,<br />
long snowbound winters in<br />
the north and in the west<br />
mountain regions.<br />
2. Teacher check<br />
3. (a) Correct order: Prince<br />
Edward Island, Nova<br />
Scotia, Ontario, New<br />
Brunswick, Quebec,<br />
Alberta, British Columbia,<br />
Manitoba, Saskatchewan,<br />
Newfoundland and<br />
Labrador, Yukon, North<br />
West Territories, Nunavut<br />
(b) Teacher check<br />
Review sample<br />
Prim-Ed Publishing – www.prim-ed.com 77 978-1-84654-917-5 <strong>Using</strong> <strong>Maps</strong><br />
BOOK 3