

Comparative study of some non-linear dry matter models in winter cereals
Abstract Approach to plant growth modeling, despite differences in patterns, is a valuable method to quantitative analysis. In the present study, several non-linear models have evaluated the growth pattern of winter cereals dry matter during two growing seasons. Therefore, Logistic, Gompertz, Richards, Weibull, Truncated-Expolinear, Symetrical-Expolinear and two Beta models used to evaluation wheat (bread wheat and durum), barley (sixrowed, two-rowed and hull less barley), triticale and oat dry matter variation. Result showed that dry matter of winter cereals have been described very well by all models. Considering RMSE and R2 among the models, Gompertz, Truncated-Expolinear, logistic, Symmetrical-Expolinear, Richards and Beta1 can be introduced as most suitable models for describing winter cereals dry matter pattern in growing season.
Abstract
Approach to plant growth modeling, despite differences in patterns, is a valuable method to quantitative analysis. In the present study, several non-linear models have evaluated the growth pattern of winter cereals dry matter during two growing seasons. Therefore, Logistic, Gompertz, Richards, Weibull, Truncated-Expolinear, Symetrical-Expolinear and two Beta models used to evaluation wheat (bread wheat and durum), barley (sixrowed, two-rowed and hull less barley), triticale and oat dry matter variation. Result showed that dry matter of winter cereals have been described very well by all models. Considering RMSE and R2 among the models, Gompertz, Truncated-Expolinear, logistic, Symmetrical-Expolinear, Richards and Beta1 can be introduced as most suitable models for describing winter cereals dry matter pattern in growing season.

Create successful ePaper yourself
Turn your PDF publications into a flip-book with our unique Google optimized e-Paper software.
Int. J. Agron. Agri. R.<br />
R 2 0.97 0.86 0.86 0.92 0.88 0.9 0.8<br />
RMSE 179.69 453.81 518.16 920.36 416.16 378.39 742.64<br />
Richards w max± SE 1646.2± 194 1451.2± 213.6 2010.9± 168.9 1804.8± 133.1 1828.1± 300.4 2027.3± 334.5 2415.3± 217.8<br />
v± SE 1.7397± 1.9504 79.3641± 2836346 169.7± 497629 1.6049± 1.4229 2.0264± 3.8981 1.6859± 2.4929 131.1± 337371<br />
k± SE 0.1126± 0.0837 3.9030± 139485 8.1342± 23857.1 0.1164± 0.0656 0.1240±0.1638 0.1031± 0.1008 6.0765± 15633.1<br />
Tm± SE 124.5± 5.2715 133.4± 30898.7 137.1± 1494.1 118.2± 4.3544 120.8± 10.0650 123.5± 7.0927 137.2± 1645.1<br />
R 2 0.98 0.8 0.56 0.98 0.94 0.97 0.95<br />
RMSE 134.78 383.33 292.59 137.14 291.15 212.32 377.15<br />
Gompertz w max± SE 2094.2± 405.7 1983.8± 513.8 2572.1± 599.2 2085.8± 226 2185± 564.8 2588.7± 653.3 3016.8± 772.7<br />
k± SE 0.0403± 0.0116 0.0528± 0.0295 0.0471± 0.0201 0.085± 0.00991 0.0448± 0.0209 0.0379± 0.0138 0.0468± 0.0217<br />
Tm± SE 119.4± 6.1039 111.3± 7.4301 115.2± 6.7772 111.4± 3.3411 113.1± 7.9437 118.4± 8.4009 115.1± 7.5007<br />
R 2 0.98 0.99 0.95 0.98 0.94 0.97 0.96<br />
RMSE 137.17 356.22 301.58 144.23 289.42 67.59 386.52<br />
Weibull w max± SE 1615.6± 60.3158 1360.2± 177.5 2133.3± 91.2843 1795.8± 50.784 1818.4± 79.2812 1993.5± 84.2357 2523.8± 973842<br />
a± SE 1.1E-16± 3.31E-16 1.83E-15±1.5E-14 6.7E-18± 3.02E-17 2.3E-1± 5E-15 5.85E-16±2.1E-15 2 E-15± 5.6E-17 2.8E-17± 1.0E-16<br />
b± SE 7.5735± 0.6098 6.9955± 1.7287 8.1933± 0.9356 7.0206± 0.4892 7.2874± 0.7848 6.9839± 0.5861 7.8938± 0.7656<br />
R 2 0.99 0.9 0.92 0.99 0.99 0.95 0.94<br />
RMSE 186.28 472.66 360.15 196.77 297.59 758.12 104.98<br />
Beta 1 w max± SE 1619.3± 39.6851 1869.7± 70.2251 2213.1± 71.7694 1839.7± 37.4448 1861.0± 56.8241 1969.3± 47.6093 2632.9± 71.3094<br />
te± SE 152± 1.7644 145.8± 0.9204 148.6± 1.3077 149± 1.2371 149± 1.6453 151± 1.6333 147.7± 0.8229<br />
tm± SE 130.9± 1.0517 126.8± 1.3270 129.1± 1.1972 126.1± 0.9050 127.3± 1.2799 129.6± 1.0382 129.3± 0.9280<br />
R 2 0.95 0.9 0.99 0.96 0.92 0.95 0.95<br />
RMSE 189.48 343.25 359.59 200.184 297.46 238.82 345.86<br />
Beta 2 w bas± SE 46.3478± 84.5908 0.0710± 167.5 9.911E-9± 0 79.23± 99.0661 74.9113± 265.3 68.9956± 207.9 1.452E-8± 231.8<br />
w max± SE 1564.7± 98.19 1619± 218.3 2002.6± 177.7 1550.9± 102.1 1467.2± 290.1 1584.1± 274.1 2378.5± 268.3<br />
tb± SE 61.0 ± 71.3191 -1.97E16±3.12E31 -1.9214± 1.42E27 61± 74.2645 61± 164.5 61± 140.4 -6.2E16± 3.682<br />
te± SE 149.4± 8.6730 137.4± 5.1208 139.1± 7.9525 142.4± 10.1793 151.3± 32.4888 153.1± 25.3384 137.8± 5.4744<br />
tm± SE 127± 6.8307 131.3± 4.4192 129.3± 4.9812 120.7±8.2831 122.8± 25.2317 126.2± 17.9536 132.1± 10.9347<br />
R 2 0.96 0.77 0.95 0.95 0.8 0.86 0.81<br />
RMSE 142.64 417.39 315.58 179.59 382.4 320.45 510.86<br />
Prelim<strong>in</strong>ary analyses <strong>of</strong> <strong>in</strong>dividual field <strong>dry</strong> <strong>matter</strong><br />
data showed that maximum plant <strong>dry</strong> <strong>matter</strong> was<br />
strongly observed <strong>in</strong> triticale while durum and oat<br />
showed the m<strong>in</strong>imum total <strong>dry</strong> <strong>matter</strong>. Behavior the<br />
growth curves <strong>of</strong> different plants can change<br />
accord<strong>in</strong>g to liv<strong>in</strong>g organisms, the phenotype,<br />
genotype, morphological and agronomic (leaf shape,<br />
leaf area <strong>in</strong>dex, plant height, and so on.) and<br />
environment condition (radiation <strong>in</strong>terception and<br />
efficiency, nutrient uptake and so on.), to which it is<br />
exposed. Various leaf area <strong>in</strong>dex and leaf expansion <strong>in</strong><br />
different <strong>cereals</strong> caused to different radiation<br />
<strong>in</strong>terception canopy and led to assimilates allocation<br />
to reproductive organs differences that is accord<strong>in</strong>g to<br />
Ghadiryan et al., (2011). Logistic, Gompertz,<br />
Richards, Weibull, Truncated Expo<strong>l<strong>in</strong>ear</strong>, Symetrical<br />
Expo<strong>l<strong>in</strong>ear</strong> and two k<strong>in</strong>ds <strong>of</strong> Beta <strong>models</strong> have been<br />
evaluated by Ghadiryan et al. (2011) <strong>in</strong> order to<br />
describe the biomass accumulation <strong>of</strong> wheat cultivars<br />
<strong>in</strong> irrigated and ra<strong>in</strong>fed conditions.<br />
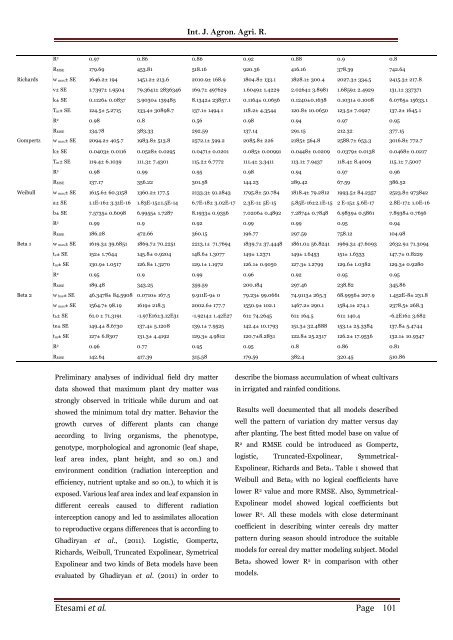
Results well documented that all <strong>models</strong> described<br />
well the pattern <strong>of</strong> variation <strong>dry</strong> <strong>matter</strong> versus day<br />
after plant<strong>in</strong>g. The best fitted model base on value <strong>of</strong><br />
R 2 and RMSE could be <strong>in</strong>troduced as Gompertz,<br />
logistic, Truncated-Expo<strong>l<strong>in</strong>ear</strong>, Symmetrical-<br />
Expo<strong>l<strong>in</strong>ear</strong>, Richards and Beta1. Table 1 showed that<br />
Weibull and Beta2 with no logical coefficients have<br />
lower R 2 value and more RMSE. Also, Symmetrical-<br />
Expo<strong>l<strong>in</strong>ear</strong> model showed logical coefficients but<br />
lower R 2 . All these <strong>models</strong> with close determ<strong>in</strong>ant<br />
coefficient <strong>in</strong> describ<strong>in</strong>g w<strong>in</strong>ter <strong>cereals</strong> <strong>dry</strong> <strong>matter</strong><br />
pattern dur<strong>in</strong>g season should <strong>in</strong>troduce the suitable<br />
<strong>models</strong> for cereal <strong>dry</strong> <strong>matter</strong> model<strong>in</strong>g subject. Model<br />
Beta2 showed lower R 2 <strong>in</strong> comparison with other<br />
<strong>models</strong>.<br />
Etesami et al. Page 101

![Review on: impact of seed rates and method of sowing on yield and yield related traits of Teff [Eragrostis teff (Zucc.) Trotter] | IJAAR @yumpu](https://documents.yumpu.com/000/066/025/853/c0a2f1eefa2ed71422e741fbc2b37a5fd6200cb1/6b7767675149533469736965546e4c6a4e57325054773d3d/4f6e6531383245617a537a49397878747846574858513d3d.jpg?AWSAccessKeyId=AKIAICNEWSPSEKTJ5M3Q&Expires=1715745600&Signature=6ZooU9WqW4%2BIRmtxpwd3O0jWxi8%3D)


