
You also want an ePaper? Increase the reach of your titles
YUMPU automatically turns print PDFs into web optimized ePapers that Google loves.
Trends in <strong>Bullying</strong> and <strong>Peer</strong> <strong>Victimization</strong> Page 2<br />
YOUTH RISK BEHAVIOR SURVEY (CENTER FOR DISEASE<br />
CONTROL)<br />
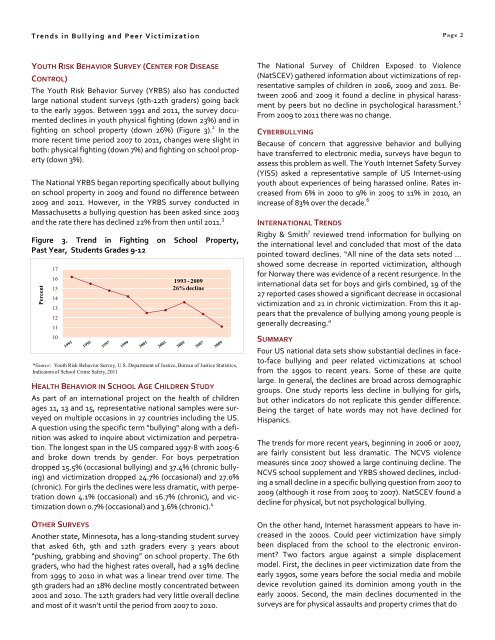
The Youth Risk Behavior Survey (YRBS) also has conducted<br />
large national student surveys (9th‐12th graders) going back<br />
to the early 1990s. Between 1991 and 2011, the survey documented<br />
declines in youth physical fighting (down <strong>23</strong>%) and in<br />
fighting on school property (down 26%) (Figure 3). 2 In the<br />
more recent time period 2007 to 2011, changes were slight in<br />
both: physical fighting (down 7%) and fighting on school property<br />
(down 3%).<br />
The National YRBS began reporting specifically about bullying<br />
on school property in 2009 and found no difference between<br />
2009 and 2011. However, in the YRBS survey conducted in<br />
Massachusetts a bullying question has been asked since 2003<br />
and the rate there has declined 22% from then until 2011. 3<br />
Figure 3. Trend in Fighting on School Property,<br />
Past Year, Students Grades 9‐12<br />
Percent<br />
17<br />
16<br />
15<br />
14<br />
<strong>13</strong><br />
12<br />
11<br />
10<br />
1993 - 2009<br />
26% decline<br />
*Source: Youth Risk Behavior Survey, U.S. Department of Justice, Bureau of Justice Statistics,<br />
Indicators of School Crime Safety, 2011<br />
HEALTH BEHAVIOR IN SCHOOL AGE CHILDREN STUDY<br />
As part of an international project on the health of children<br />
ages 11, <strong>13</strong> and 15, representative national s<strong>amp</strong>les were surveyed<br />
on multiple occasions in 27 countries including the US.<br />
A question using the specific term "bullying" along <strong>with</strong> a definition<br />
was asked to inquire about victimization and perpetration.<br />
The longest span in the US compared 1997‐8 <strong>with</strong> 2005‐6<br />
and broke down trends by gender. For boys perpetration<br />
dropped 15.5% (occasional bullying) and 37.4% (chronic bullying)<br />
and victimization dropped 24.7% (occasional) and 27.0%<br />
(chronic). For girls the declines were less dramatic, <strong>with</strong> perpetration<br />
down 4.1% (occasional) and 16.7% (chronic), and victimization<br />
down 0.7% (occasional) and 3.6% (chronic). 4<br />
OTHER SURVEYS<br />
Another state, Minnesota, has a long‐standing student survey<br />
that asked 6th, 9th and 12th graders every 3 years about<br />
“pushing, grabbing and shoving” on school property. The 6th<br />
graders, who had the highest rates overall, had a 19% decline<br />
from 1995 to 2010 in what was a linear trend over time. The<br />
9th graders had an 18% decline mostly concentrated between<br />
2001 and 2010. The 12th graders had very little overall decline<br />
and most of it wasn’t until the period from 2007 to 2010.<br />
The National Survey of Children Exposed to Violence<br />
(NatSCEV) gathered information about victimizations of representative<br />
s<strong>amp</strong>les of children in 2006, 2009 and 2011. Between<br />
2006 and 2009 it found a decline in physical harassment<br />
by peers but no decline in psychological harassment. 5<br />
From 2009 t0 2011 there was no change.<br />
CYBERBULLYING<br />
Because of concern that aggressive behavior and bullying<br />
have transferred to electronic media, surveys have begun to<br />
assess this problem as well. The Youth Internet Safety Survey<br />
(YISS) asked a representative s<strong>amp</strong>le of US Internet‐using<br />
youth about experiences of being harassed online. Rates increased<br />
from 6% in 2000 to 9% in 2005 to 11% in 2010, an<br />
increase of 83% over the decade. 6<br />
INTERNATIONAL TRENDS<br />
Rigby & Smith 7 reviewed trend information for bullying on<br />
the international level and concluded that most of the data<br />
pointed toward declines. “All nine of the data sets noted …<br />
showed some decrease in reported victimization, although<br />
for Norway there was evidence of a recent resurgence. In the<br />
international data set for boys and girls combined, 19 of the<br />
27 reported cases showed a significant decrease in occasional<br />
victimization and 21 in chronic victimization. From this it appears<br />
that the prevalence of bullying among young people is<br />
generally decreasing.”<br />
SUMMARY<br />
Four US national data sets show substantial declines in faceto‐face<br />
bullying and peer related victimizations at school<br />
from the 1990s to recent years. Some of these are quite<br />
large. In general, the declines are broad across demographic<br />
groups. One study reports less decline in bullying for girls,<br />
but other indicators do not replicate this gender difference.<br />
Being the target of hate words may not have declined for<br />
Hispanics.<br />
The trends for more recent years, beginning in 2006 or 2007,<br />
are fairly consistent but less dramatic. The NCVS violence<br />
measures since 2007 showed a large continuing decline. The<br />
NCVS school supplement and YRBS showed declines, including<br />
a small decline in a specific bullying question from 2007 to<br />
2009 (although it rose from 2005 to 2007). NatSCEV found a<br />
decline for physical, but not psychological bullying.<br />
On the other hand, Internet harassment appears to have increased<br />
in the 2000s. Could peer victimization have simply<br />
been displaced from the school to the electronic environment?<br />
Two factors argue against a simple displacement<br />
model. First, the declines in peer victimization date from the<br />
early 1990s, some years before the social media and mobile<br />
device revolution gained its dominion among youth in the<br />
early 2000s. Second, the main declines documented in the<br />
surveys are for physical assaults and property crimes that do