

Rails Magazine - Issue 3
Rails Magazine - Issue 3
Rails Magazine - Issue 3

You also want an ePaper? Increase the reach of your titles
YUMPU automatically turns print PDFs into web optimized ePapers that Google loves.
20<br />
JRuby Tip: Monitoring with JMX by Joshua Moore<br />
20<br />
JRuby Tip: Monitoring with JMX<br />
by Joshua Moore<br />
What is JMX?<br />
JMX (Java Management Extensions) is a Java TM tool used<br />
to monitor and control a Java TM process. Since JRuby is a<br />
Java TM process, it can also be monitored using JMX. The great<br />
thing about JMX is that it is not just one way communication.<br />
You can also use JMX to change settings within the JRuby/<br />
Java TM process and within your own application. This article<br />
will only cover the briefest of introductions about JMX. The<br />
goal is to help you get started using it.<br />
JConsole<br />
JConsole is the default JMX client provided with the JDK<br />
(JavaTM Development Kit). Unfortunately, it is not part of the<br />
JRE (JavaTM Runtime Environment) so if you do not have it<br />
you will need to download and install the JDK. JConsole is a<br />
simple application that connects to a JavaTM process and then<br />
displays the collected information to the user. It can also be<br />
used to set variables within the JavaTM process. To get started<br />
with JConsole simply execute one of these commands (depending<br />
on your OS type):<br />
• Windows: c:\path\to\java\bin\jconsole.exe<br />
• Linux: jconsole (it should be added to the path with the<br />
Java TM command) or /path/to/java/bin/jconsole<br />
• Mac: Sorry, I cannot afford a Mac right now but I guess<br />
it would be similar to Linux (currently the Josh Moore<br />
Mac fund is accepting donations).<br />
* One bug with JMX on Linux is that JMX uses the IP<br />
address found in the /etc/hosts file to connect to the Java TM<br />
process. So if you execute hostname -i on the machine running<br />
the JRuby process you want to monitor, and the output is not<br />
your IP address, then you will need to modify the /etc/hosts<br />
file and then restart your network process or restart your<br />
computer.<br />
* You should be aware that the information gathered by<br />
JConsole is session based, so when the connection is closed<br />
all the gathered information will be lost.<br />
Setup the Jruby/JavaTM process<br />
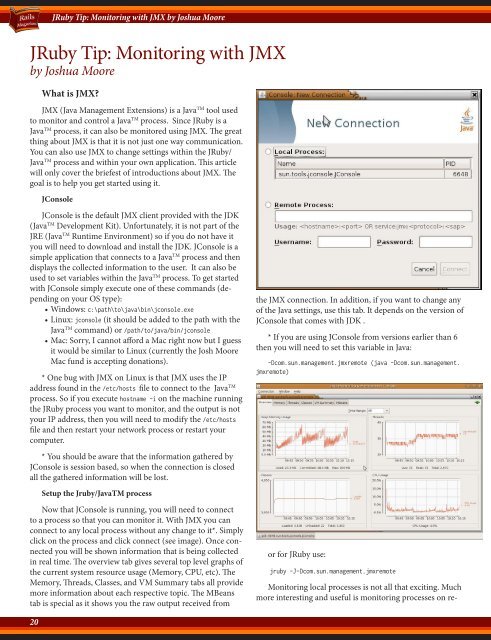
Now that JConsole is running, you will need to connect<br />
to a process so that you can monitor it. With JMX you can<br />
connect to any local process without any change to it*. Simply<br />
click on the process and click connect (see image). Once connected<br />
you will be shown information that is being collected<br />
in real time. The overview tab gives several top level graphs of<br />
the current system resource usage (Memory, CPU, etc). The<br />
Memory, Threads, Classes, and VM Summary tabs all provide<br />
more information about each respective topic. The MBeans<br />
tab is special as it shows you the raw output received from<br />
the JMX connection. In addition, if you want to change any<br />
of the Java settings, use this tab. It depends on the version of<br />
JConsole that comes with JDK .<br />
* If you are using JConsole from versions earlier than 6<br />
then you will need to set this variable in Java:<br />
-Dcom.sun.management.jmxremote (java -Dcom.sun.management.<br />
jmxremote)<br />
or for JRuby use:<br />
jruby -J-Dcom.sun.management.jmxremote<br />
Monitoring local processes is not all that exciting. Much<br />
more interesting and useful is monitoring processes on re-