

Obura_Sustainability-preprints201812.0176.v1 ESM

Create successful ePaper yourself
Turn your PDF publications into a flip-book with our unique Google optimized e-Paper software.
5<br />
145<br />
146<br />
147<br />
148<br />
149<br />
150<br />
151<br />
152<br />
153<br />
154<br />
155<br />
156<br />
157<br />
158<br />
159<br />
160<br />
161<br />
162<br />
163<br />
costs associated with reduction of impacts at source may be less than costs<br />
associated with those impacts borne by broader society, but not well-costed<br />
or accurately attributed, so this may be a matter of just attribution of costs.<br />
The IPAT model has been debated extensively in the past and does have its weaknesses. These<br />
are summarized as follows [58]: "IPAT itself has been criticized because it does not account for<br />
interactions among the terms (e.g., increasing affluence can lead to more efficient technologies); it<br />
omits explicit reference to important variables such as culture and institutions (e.g., social<br />
organization); impact is not linearly related to the right side variables (there can be important<br />
thresholds); and it can simply lead to wrong conclusions." The intent here is not to ignore these<br />
problems, as they can be addressed in specific circumstances. Rather, the intent is to return to a<br />
simpler expression of causal relationships [37] that through their relevance and accessibility to<br />
people, businesses and politics, can stimulate behaviour change [8].<br />
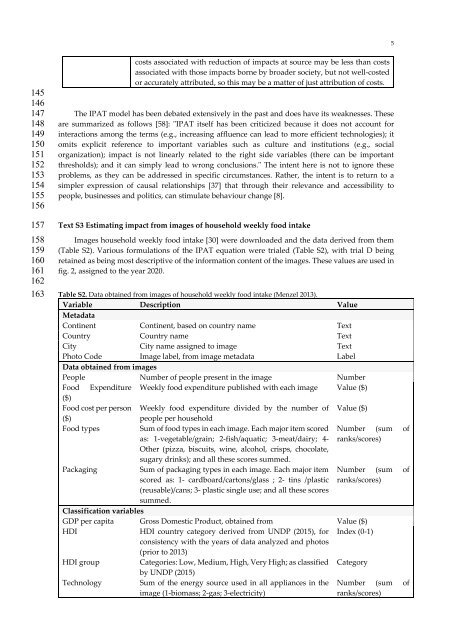
Text S3 Estimating impact from images of household weekly food intake<br />
Images household weekly food intake [30] were downloaded and the data derived from them<br />
(Table S2). Various formulations of the IPAT equation were trialed (Table S2), with trial D being<br />
retained as being most descriptive of the information content of the images. These values are used in<br />
fig. 2, assigned to the year 2020.<br />
Table S2. Data obtained from images of household weekly food intake (Menzel 2013).<br />
Variable Description Value<br />
Metadata<br />
Continent Continent, based on country name Text<br />
Country Country name Text<br />
City City name assigned to image Text<br />
Photo Code Image label, from image metadata Label<br />
Data obtained from images<br />
People Number of people present in the image Number<br />
Food Expenditure Weekly food expenditure published with each image Value ($)<br />
($)<br />
Food cost per person Weekly food expenditure divided by the number of Value ($)<br />
($)<br />
people per household<br />
Food types<br />
Sum of food types in each image. Each major item scored Number (sum of<br />
as: 1-vegetable/grain; 2-fish/aquatic; 3-meat/dairy; 4- ranks/scores)<br />
Other (pizza, biscuits, wine, alcohol, crisps, chocolate,<br />
sugary drinks); and all these scores summed.<br />
Packaging<br />
Sum of packaging types in each image. Each major item<br />
scored as: 1- cardboard/cartons/glass ; 2- tins /plastic<br />
(reusable)/cans; 3- plastic single use; and all these scores<br />
summed.<br />
Classification variables<br />
Number (sum of<br />
ranks/scores)<br />
GDP per capita Gross Domestic Product, obtained from Value ($)<br />
HDI<br />
HDI country category derived from UNDP (2015), for Index (0-1)<br />
consistency with the years of data analyzed and photos<br />
(prior to 2013)<br />
HDI group<br />
Categories: Low, Medium, High, Very High; as classified Category<br />
by UNDP (2015)<br />
Technology Sum of the energy source used in all appliances in the Number (sum of<br />
image (1-biomass; 2-gas; 3-electricity)<br />
ranks/scores)


