- Page 1 and 2: PAGE 1 OF 226
- Page 3 and 4: DTFX MARKETING PRODUCTIONS, SOUTH A
- Page 5 and 6: First Published: January 2019 For m
- Page 7 and 8: PREFACE FOREX MILLIONAIRE IN 365 DA
- Page 9 and 10: hearts desires and perpetual needs
- Page 11 and 12: own resurrection. As best as I can,
- Page 13 and 14: DIFFERENT WAYS TO TRADE FX Over the
- Page 15 and 16: We use fundamental analysis in the
- Page 17 and 18: 3. PRACTICE The best way to get a f
- Page 19 and 20: your leverage ratio in accordance w
- Page 21 and 22: 8. KEEP IT SLOW AND STEADY One key
- Page 23 and 24: TECHNICAL ANALYSIS WHY CANDLESTICKS
- Page 25 and 26: Using candlestick patterns will hel
- Page 27 and 28: Long bodies refer to strong buying
- Page 29 and 30: CANDLESTICK PATTERNS Candlestick pa
- Page 31 and 32: find in the market, in this chapter
- Page 33 and 34: When this pattern occurs at the end
- Page 35 and 36: The bullish engulfing bar pattern T
- Page 37 and 38: The example above shows us clearly
- Page 39 and 40: PAGE 39 OF 226
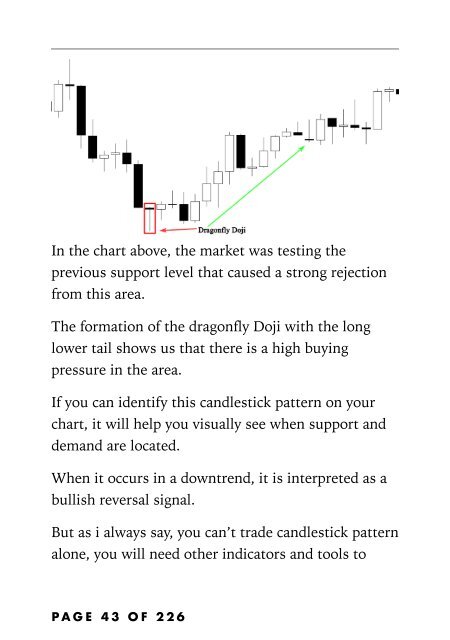
- Page 41: Remember always that a Doji indicat
- Page 45 and 46: The image above illustrates a perfe
- Page 47 and 48: As a trader, you will need addition
- Page 49 and 50: The chart above helps us identify t
- Page 51 and 52: But here, the Doji candle indicated
- Page 53 and 54: Right now, everything is going all
- Page 55 and 56: characterized by a long lower shado
- Page 57 and 58: created, you will be able to predic
- Page 59 and 60: When this candlestick forms near a
- Page 61 and 62: In the next chapters, i will talk a
- Page 63 and 64: As you see the smaller body is tota
- Page 65 and 66: ottom of a downtrend, sellers were
- Page 67 and 68: The tweezers top formation consists
- Page 69 and 70: The chart above shows us a tweezers
- Page 71 and 72: Let’s try to answer the questions
- Page 73 and 74: 4: Bullish engulfing bar Please, i
- Page 75 and 76: What the crowds are doing? Who is i
- Page 77 and 78: The example above shows a bearish m
- Page 79 and 80: But the question is what is the rig
- Page 81 and 82: The illustration above shows a down
- Page 83 and 84: Support and resistance are proven a
- Page 85 and 86: By drawing a support level in an up
- Page 87 and 88: Don’t use smaller time frame to d
- Page 89 and 90: The Ranging Market Ranging markets
- Page 91 and 92: But ranging markets tend to move ho
- Page 93 and 94:
As you can see, the market is movin
- Page 95 and 96:
The pullback is another chance to j
- Page 97 and 98:
find a lot of noise, you can’t ev
- Page 99 and 100:
Time frames and top down analysis A
- Page 101 and 102:
try to find a way to follow them on
- Page 103 and 104:
The second information is the rejec
- Page 105 and 106:
Look at what happened next: As you
- Page 107 and 108:
from this level which indicates tha
- Page 109 and 110:
The example above shows that counte
- Page 111 and 112:
The second aspect is the level: you
- Page 113 and 114:
The area between the open and close
- Page 115 and 116:
How to identify pin bar candlestick
- Page 117 and 118:
trying to put the probabilities of
- Page 119 and 120:
-The anatomy of a pin bar is import
- Page 121 and 122:
If you understand the psychology be
- Page 123 and 124:
The formation of the pin bar indica
- Page 125 and 126:
The 4-hour chart above illustrates
- Page 127 and 128:
The chart above shows how an aggres
- Page 129 and 130:
entry method helps us decrease our
- Page 131 and 132:
The trend: it is one of the most im
- Page 133 and 134:
1- The Trend: the market is trading
- Page 135 and 136:
trading setups to come to you, inst
- Page 137 and 138:
The second reason is the formation
- Page 139 and 140:
The same thing happens with the sec
- Page 141 and 142:
closes, or you wait for the market
- Page 143 and 144:
This is how professional traders tr
- Page 145 and 146:
What you have to do in this case is
- Page 147 and 148:
This reversal candlestick pattern c
- Page 149 and 150:
According to Steve Nison, the fathe
- Page 151 and 152:
The illustration above shows a clea
- Page 153 and 154:
Conversely, if prices test a resist
- Page 155 and 156:
Your ability to identify an engulfi
- Page 157 and 158:
Because you will get lot of false s
- Page 159 and 160:
How to trade the engulfing bar with
- Page 161 and 162:
In the example above, the engulfing
- Page 163 and 164:
By connecting the extreme highs, we
- Page 165 and 166:
One of the most difficult markets t
- Page 167 and 168:
ecause not all sideways markets are
- Page 169 and 170:
False breakouts are one of the most
- Page 171 and 172:
Pay more attention to the way the p
- Page 173 and 174:
If you can combine trading supply a
- Page 175 and 176:
As you can see all the conditions w
- Page 177 and 178:
When you set your protective stop a
- Page 179 and 180:
PAGE 179 OF 226
- Page 181 and 182:
which is the opposite of the engulf
- Page 183 and 184:
The inside bar can be traded succes
- Page 185 and 186:
mother candle. Your profit target i
- Page 187 and 188:
chart, you will notice that the sup
- Page 189 and 190:
you will know that the safest entry
- Page 191 and 192:
i recommend you to stick with tradi
- Page 193 and 194:
Banks and financial institutions kn
- Page 195 and 196:
PAGE 195 OF 226
- Page 197 and 198:
This setup can be considered as a c
- Page 199 and 200:
As illustrated above, big players h
- Page 201 and 202:
how to use it in a simple and effic
- Page 203 and 204:
Fibonacci tool can be used to trade
- Page 205 and 206:
But if the market is ranging, you h
- Page 207 and 208:
interesting about it, is that the r
- Page 209 and 210:
The second signal was an engulfing
- Page 211 and 212:
As you can see in the chart above,
- Page 213 and 214:
trading 3 mini lots of CAD/USA, thi
- Page 215 and 216:
The importance of a Stop loss All g
- Page 217 and 218:
Because trading is all about emotio
- Page 219 and 220:
You have everything you need here,
- Page 221 and 222:
involved. I would make several chan
- Page 223 and 224:
ABOUT THE AUTHOR Have you ever wond
- Page 225 and 226:
youth from the previously disadvant