Slides of Nick Crafts' RES Policy Lecture
Slides of Nick Crafts' RES Policy Lecture
Slides of Nick Crafts' RES Policy Lecture

Create successful ePaper yourself
Turn your PDF publications into a flip-book with our unique Google optimized e-Paper software.
POLICY LECTURE<br />
Returning To Growth:<br />
Lessons From History<br />
By Pr<strong>of</strong>essor Nicholas Crafts<br />
Chaired by Pr<strong>of</strong>essor Wendy Carlin
Returning to Growth:<br />
<strong>Policy</strong> Lessons from History<br />
Nicholas Crafts<br />
<strong>RES</strong> <strong>Policy</strong> <strong>Lecture</strong>,<br />
October 17, 2012
Promoting Recovery<br />
• 3 basic possible (not mutually exclusive)<br />
strategies<br />
• fiscal stimulus<br />
• monetary stimulus<br />
• supply-side reforms<br />
• NB: fiscal stimulus is ruled out by fiscal<br />
consolidation (Plan A) and monetary<br />
stimulus has to be ‘unconventional’ at ZLB
Supply-Side Reforms<br />
• Could stimulate private-sector investment and<br />
TFP growth<br />
• As well as infrastructure and human capital,<br />
competition, regulation and taxation policies<br />
matter for medium-term growth<br />
• Problem is these mostly have medium/longrather<br />
than short-term effects<br />
• Short term may conflict with long-term
Fiscal Consolidation<br />
• Cutting government spending and raising<br />
taxes to improve fiscal sustainability<br />
• Often urgently needed after banking<br />
crises, wars or pr<strong>of</strong>ligate governments<br />
• Risks adverse impact on GDP in short<br />
term if not <strong>of</strong>fset by monetary stimulus or<br />
other boost to private sector activity
Take Fiscal Consolidation as a<br />
Given<br />
• It is the basis <strong>of</strong> the Coalition Agreement<br />
• Delaying fiscal consolidation risks excessive D/Y<br />
• Return to ‘financial repression’ (capital<br />
controls, g > r) which would permit much looser<br />
fiscal policy while maintaining fiscal sustainability<br />
neither feasible nor desirable<br />
• NB: the composition <strong>of</strong> fiscal consolidation is a<br />
big issue
Fiscal Consolidation and Productivity<br />
• Reduction in ‘non-productive’ government<br />
expenditure and raising indirect taxes more<br />
favourable for growth than raising direct taxes and<br />
cutting ‘productive’ expenditure<br />
• Effects can also work through NAIRU (benefits),<br />
labour force participation (retirement), efficiency<br />
(privatization, subsidy withdrawal)<br />
• Design should presumably has to take account <strong>of</strong><br />
political constraints and ‘fairness’ issues; otherwise<br />
easy to devise strategy that is good for supply-side
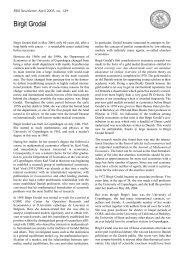
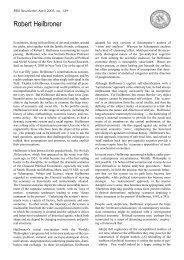
3 Periods <strong>of</strong> Recession and Recovery:<br />
1930s, 1980s and Now<br />
• Common feature is fiscal consolidation but<br />
banking crisis is new<br />
• Similar downturns initially but different policy<br />
responses<br />
• In both previous episodes there was a strong<br />
recovery which started around 4 years after the<br />
recession began<br />
• SO: what can we learn?
Sources: Mitchell et al. (2012); ONS<br />
Real GDP (Quarterly)
The 1930s UK Recovery: 1 st Phase<br />
• Started during fiscal consolidation which<br />
reduced structural deficit by 4%GDP between<br />
1930 and 1934<br />
• Strong growth 1933-35 based on monetary<br />
stimulus which <strong>of</strong>fset negative impact <strong>of</strong> fiscal<br />
policy: the key was credibly to commit to<br />
moderate inflation as a way to reduce real<br />
interest rates<br />
• Exit from gold standard plus ‘cheap money’;<br />
housing investment led the recovery
Public Finances (% GDP)<br />
Net Public Debt Budget Deficit Structural Deficit<br />
1929 158.4 0.7 -0.4<br />
1930 159.2 1.4 -1.1<br />
1931 169.8 2.2 -2.5<br />
1932 173.6 0.5 -3.0<br />
1933 179.2 -0.4 -4.2<br />
1934 173.1 -0.5 -3.2<br />
1935 165.0 0.3 -2.0<br />
1936 158.7 0.7 -0.8<br />
1937 147.2 1.5 0.1<br />
Source: Middleton (1996)
The ‘Cheap Money’ <strong>Policy</strong><br />
• Was a coherent framework arrived at by mid-1932 with<br />
HMT not B <strong>of</strong> E in charge<br />
• Aim to raise the price level and to underpin this by<br />
holding exchange rate at $3.40 then FFr. 88<br />
• Short term interest rates kept at lower bound and real<br />
interest rates became negative after 1933<br />
• Credible because it was clearly in HMT’s interests as a<br />
route to recovery that did not open Pandora’s Box and<br />
improved fiscal arithmetic
Treasury Bill Rate (%)(1930q1-1938q1)<br />
Sources: Howson (1975); derived from Capie and Collins (1983)
House-Building in the 1930s<br />
• They built a lot <strong>of</strong> houses by our standards:<br />
293,000 in peak year<br />
• Building societies provided ample mortgage<br />
finance, deposits fell, repayment periods were<br />
extended and the possibility <strong>of</strong> buying a house<br />
came in reach <strong>of</strong> a new group <strong>of</strong> people<br />
• For developers, after 1932 there was no good<br />
reason to delay and there were virtually no<br />
planning restrictions
Houses Built (without state assistance),<br />
Six Months Ending<br />
Source: Stolper (1941)
The 1930s UK Recovery: 2 nd Phase<br />
• From 1935 onwards, rearmament central<br />
• Large exogenous fiscal shock with short-term<br />
interest rates held constant<br />
• Probably raised real GDP by about 7.5% in 1938<br />
but fiscal multiplier only 0.5-0.8; expectations <strong>of</strong><br />
future defence spending crowded in investment<br />
• Explanation for ‘low’ multiplier may be high D/Y
The “Managed Economy” in<br />
1930s UK<br />
• Post-1932 policy package included capital controls,<br />
devaluation, tariffs, cheap money and cartels<br />
• Understandable as a short-term fix to raise prices at<br />
ZLB at a time <strong>of</strong> high unemployment<br />
• Regrettable in terms <strong>of</strong> long-term implications for<br />
productivity performance; retreat from competition very<br />
hard to reverse<br />
• Weak competition was a key factor that sustained bad<br />
management and dysfunctional industrial relations
Competition and Productivity<br />
Performance<br />
• Research on postwar UK says weak competition<br />
a big problem for productivity until 1980s<br />
• Weak competition in product markets nurtured<br />
infamous industrial relations and management<br />
problems<br />
• Vested interests politically strong enough to<br />
block strong anti-trust and trade liberalization<br />
policies so 1930s legacy lasted several<br />
decades
Lessons about Recovery (1)<br />
• Conventional inflation targeting may be<br />
inappropriate with fiscal consolidation at ZLB<br />
post banking crisis if need to cut real interest<br />
rates<br />
• If can deliver monetary stimulus, want to<br />
address transmission mechanism to ‘crowd in’<br />
investment<br />
• Should not assume fiscal multiplier necessarily<br />
high at ZLB
1980s Relevance to Today<br />
• Recovery came without policies designed to stimulate<br />
aggregate demand<br />
• Strategy for disinflation entailed high real interest rates<br />
and eliminating the budget deficit<br />
• The real success was to improve supply-side policies<br />
leading to higher TFP growth, a lower NAIRU<br />
and rapid diffusion <strong>of</strong> ICT<br />
• De-regulation stimulated bank lending and consumer<br />
spending and set the scene for the expansion <strong>of</strong> the<br />
financial sector
Treasury Bill Rate (%) (1979q2-1987q2)<br />
Sources: Bank <strong>of</strong> England; derived from ONS
Public Finances (% GDP)<br />
Net Public Debt Budget Deficit Structural Deficit<br />
1979 44.0 4.1 4.0<br />
1980 46.1 4.8 3.4<br />
1981 46.1 2.3 -1.5<br />
1982 44.8 3.0 -1.4<br />
1983 45.1 3.7 0.0<br />
1984 45.1 3.6 0.6<br />
1985 43.2 2.4 0.6<br />
1986 40.9 2.0 1.9<br />
1987 36.6 1.0 2.2<br />
Source: IFS
1980s’ Supply-Side <strong>Policy</strong><br />
• From industrial to competition policy<br />
• Privatization promoted<br />
• Taxation restructured<br />
• Benefit/wage ratios reduced<br />
• Trade-union power undermined<br />
• De-industrialization accepted
From Industrial to Competition<br />
<strong>Policy</strong><br />
• Trade policy liberalized through EU<br />
membership and GATT rounds<br />
• Subsidies largely withdrawn<br />
• De-regulation<br />
• Competition policy belatedly strengthened<br />
through 1998 and 2002 Acts<br />
• NB: before, during and after Thatcher
1970s Experience<br />
• Strong bias towards subsidizing ailing industries, e.g.,<br />
shipbuilding (Wren, 1996) also reflected in pattern <strong>of</strong> tariff<br />
protection (Greenaway & Milner, 1994)<br />
• Subsidizing hi –tech national champions failed in civil<br />
aircraft (Gardner, 1976), computers (Hendry, 1989), nuclear<br />
power (Cowan, 1990)<br />
• Rates <strong>of</strong> return on NEB portfolio very poor (Hindley &<br />
Richardson, 1983)<br />
• Investment subsidies a costly mistake – huge<br />
deadweight loss and little or no impact on investment<br />
(Sumner, 1989)
Competition and Productivity Growth<br />
• Absence <strong>of</strong> competition allows managers to be<br />
sleepy if ineffective control/monitoring by<br />
shareholders<br />
• Competition is strongly positive for productivity<br />
outcomes in UK firms without dominant<br />
shareholder (<strong>Nick</strong>ell et al., 1997)<br />
• Competition promotes better management<br />
practices (Bloom and van Reenen, 2007)<br />
• Strengthening competition addressed<br />
Britain’s Golden-Age productivity problem<br />
quite effectively (Crafts, 2012)
Increased Competition and Productivity<br />
Performance<br />
• Increases in competition correlated with 1980s<br />
productivity growth at sectoral level (Haskel, 1991);<br />
openness promoted TFP growth in manufacturing<br />
sectors post-1970 (Proudman & Redding, 1998)<br />
• Single Market shock improved TFP performance in<br />
plants exposed to agency problems (Griffith, 2001)<br />
• Post-1980, competition for corporate control meant<br />
restructuring and divestment in large firms (Toms & Wright,<br />
2002); management buyouts raised TFP (Harris et al., 2005)<br />
• Entry & exit: 25% Y/L growth in 1980-5 manufacturing<br />
rising to 40% in 1995-2000 (Crisculo et al., 2004)
Increased Competition:<br />
Effects via Industrial Relations<br />
• During the 1980s and 1990s, increased<br />
competition reduced union membership, union<br />
wage mark-ups and union effects on productivity<br />
(Brown et al., 2008; Metcalf, 2002)<br />
• Surge <strong>of</strong> productivity growth in unionized firms in<br />
1980s via organizational change under<br />
pressure <strong>of</strong> competition (Machin & Wadhwani, 1989)<br />
• De-recognition <strong>of</strong> unions in face <strong>of</strong><br />
increased foreign competition had strong<br />
effect on productivity growth in late 1980s<br />
(Gregg et al., 1993)
Levels <strong>of</strong> Productivity in the Market Sector (UK = 100)<br />
Y/HW<br />
France<br />
W. Germany<br />
/Germany<br />
USA<br />
1973 95 132 160<br />
1979 112 157 166<br />
1991 123 161/143 156<br />
1995 117 133 146<br />
2007 109 119 147<br />
TFP<br />
1973 87 112 127<br />
1979 103 135 135<br />
1991 110 133/123 128<br />
1995 104 115 123<br />
2007 101 110 125<br />
Data from Mary O'Mahony
Recent History <strong>of</strong> UK NAIRU<br />
• <strong>Policy</strong> changes contributed to substantial<br />
reduction in U* from 1980s notably through<br />
improved industrial relations, lower employment<br />
taxes and unemployment benefits reform<br />
• The key decisions that lowered U* were made<br />
by the Conservatives (<strong>Nick</strong>ell & Quintini, 2002)<br />
NB: lowering the NAIRU has adverse battingaverage<br />
effect on labour productivity: perhaps 6<br />
percentage points vis-à-vis France in 2007
Real GDP/Person (UK = 100 in each year)<br />
USA<br />
West<br />
Germany<br />
France<br />
1870 76.6 57.6 58.8<br />
1913 107.8 74.1 70.8<br />
1929 125.3 73.6 85.6<br />
1937 103.4 75.4 72.2<br />
1950 137.7 61.7 74.7<br />
1979 142.7 115.9 111.1<br />
2007 132.6 98.6 94.3<br />
Note: estimates refer to Germany from 1870 to 1937.<br />
Sources: Angus Maddison historical database and West Germany in 2007 calculated from Statistiches<br />
Bundesamt Deutschland 2010.
UK in the ICT Age<br />
• Invests relatively large amount in ICT<br />
capital with positive productivity effects<br />
• This requires reorganization and is<br />
supported by light regulation<br />
• This would not have happened with<br />
1970s-style industrial relations and weak<br />
competition
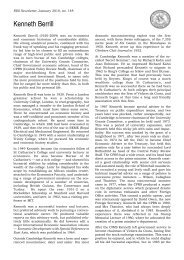
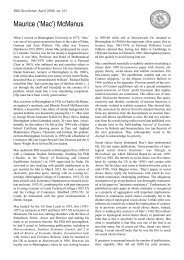
Regulation and the contribution <strong>of</strong> ICT-using services<br />
to aggregate productivity growth<br />
ICT using services, 1996-2001<br />
1.3<br />
0.8<br />
0.3<br />
-0.2<br />
GBR<br />
USA<br />
IRL<br />
CAN<br />
AUS<br />
SWE<br />
NLD<br />
JPN<br />
MEX<br />
AUT<br />
NOR<br />
DNK<br />
CHE<br />
DEU<br />
KOR<br />
0 0.5 1 1.5 2 2.5 3 3.5<br />
Product market regulation (inward-oriented), 1998<br />
Correlation coefficient: -0.62<br />
t-statistic: -3.35<br />
ESP<br />
FIN<br />
BEL<br />
FRA<br />
ITA<br />
Source: Nicoletti & Scarpetta (2005)
Sources <strong>of</strong> Labour Productivity Growth in the<br />
Market Sector, 1995-2005 (% per year)<br />
Labour<br />
Quality<br />
ICT<br />
K/HW<br />
Non-ICT<br />
K/HW<br />
TFP<br />
Growth<br />
Y/L<br />
Growth<br />
France 0.4 0.4 0.4 0.9 2.1<br />
Germany 0.1 0.5 0.6 0.4 1.6<br />
UK 0.5 0.9 0.4 0.8 2.6<br />
USA 0.3 1.0 0.3 1.3 2.9<br />
Source: Timmer et al. (2010)
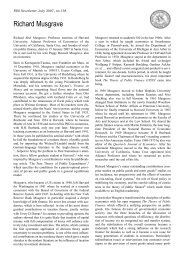
Financial De-Regulation and<br />
1980s’ Recovery<br />
• Major liberalization <strong>of</strong> financial markets reflected<br />
in CCI index (Fernandez-Corugedo & Muellbauer, 2006)<br />
• Relaxation <strong>of</strong> constraints directly and indirectly<br />
raised personal sector borrowing and lowered<br />
household savings rate<br />
• Impact raised consumption by 3.5%GDP<br />
(Muellbauer, 2008) and improved supply-side<br />
• NB: ultimately de-regulation and bank leverage<br />
went too far (cf. Miles et al., 2012)
Household Savings Ratio (%)<br />
Sources: ONS
Credit Conditions Index<br />
Data kindly supplied by John Muellbauer: scale adjusted
Lessons (2)<br />
• The 1980s is an episode <strong>of</strong> fiscal consolidation<br />
that improved the supply-side<br />
• Lots <strong>of</strong> bad policies to dump (not all <strong>of</strong> which<br />
were dealt with); strengthening competition was<br />
central<br />
• 364 economists underestimated the value <strong>of</strong><br />
supply-side reform in promoting recovery<br />
• De-regulation ‘crowded in’ private sector<br />
spending
Macroeconomic <strong>Policy</strong> and Post-2009<br />
Recovery<br />
• Recovery has faltered badly in the last 2 years; “strong<br />
headwinds” from Euro, household real incomes and<br />
debts, weak bank lending<br />
• Fiscal stimulus ruled out by worries about fiscal<br />
sustainability given large post-crisis structural deficit<br />
• Nominal interest rates at the ZLB; 2% inflation targeting<br />
cannot be abandoned<br />
• Suggests ‘growth-friendly’ fiscal consolidation and<br />
supply-side reforms should be prominent
Bank Advances to Non-Bank Private Sector<br />
Sources: Bankers’ Magazine; Bank <strong>of</strong> England
Fiscal Consolidation since 2010:<br />
Growth Friendly?<br />
• Good News:<br />
corporate tax rate reduced from 28% to 23% in<br />
2014/15 and VAT raised to 20% in January 2011<br />
• Bad News:<br />
public net investment cut by 45% while current<br />
expenditure up by 18% by 2016/17<br />
VAT base not widened<br />
917,000 more higher-rate but 1,800,000 fewer<br />
basic-rate taxpayers in 2012/13
Government Outlays (£bn., current)<br />
(OBR, 2011, 2012)<br />
2009/10 2016/17<br />
Current 600.9 708.6<br />
Social Security 162.8 199.3<br />
Debt Interest 30.9 64.0<br />
Net Investment 49.5 22.1<br />
Total Managed Expenditure 669.7 756.3
UK Success Stories<br />
• Have been promoted by horizontal not selective<br />
industrial policy<br />
• Pharma: human capital, science base<br />
• Financial Services: human capital, deregulation,<br />
planning reform, transport<br />
• ICT Diffusion: human capital, industrial<br />
relations reform, less obstructive regulation than<br />
elsewhere in Europe
Horizontal Industrial Policies:<br />
Could Do Better<br />
• Infrastructure<br />
• Education<br />
• Taxation<br />
• Regulation<br />
NB: effects on growth through the incentives to<br />
invest, innovate and adopt new technologies
Infrastructure: Not Good Enough<br />
• Pre-crisis investment in public capital shortfall:<br />
1.3% GDP per year below growth-maximizing<br />
amount (Crafts, 2009)<br />
• E.g, lots <strong>of</strong> road projects with high BCR not done<br />
• Eddington Report (2006) – big welfare gains and<br />
tax revenues from efficient programme <strong>of</strong> road<br />
building and road pricing – ignored<br />
• Perhaps roads should be provided by a<br />
regulated utility (Helm, 2012)
Education: Could Do Better<br />
• ‘Cognitive skills’ strongly correlated with long-run<br />
growth; 100 test-score points → 1.4 ppts per year<br />
(Hanushek & Woossman, 2011)<br />
• Institutional design matters a lot for educational<br />
outcomes (principal-agent)<br />
• International comparisons suggest UK could raise scores<br />
considerably by greater private operation (and probably<br />
by having higher-quality exams) (OECD, 2007)<br />
• Key point: better incentive structures could improve<br />
educational quality without spending more money
Cognitive Skills: Top 6 and UK, 2009<br />
(OECD, PISA Maths & Science average)<br />
Shanghai, China 586 Korea 542<br />
Hong Kong, China 552 Japan 534<br />
Singapore 552<br />
Finland 548 UK 503
Tax Doesn’t Have to be So Taxing<br />
• Mirrlees Review (2011) presents powerful case<br />
for reform<br />
• For example, revenue-neutral extension <strong>of</strong> VAT<br />
base to all consumption and reform <strong>of</strong> capital<br />
taxation by exempting normal rate <strong>of</strong> return to<br />
raise GDP by 1.4% and investment by 6.1%<br />
• More generally, OECD research finds significant<br />
increases to GDP from shifting taxes from<br />
income to consumption and property (Arnold et<br />
al., 2011)
Planning Rules Matter<br />
• An important horizontal ‘industrial policy’<br />
• Planning restrictions impose massive distortions<br />
in land use – regulatory tax rate <strong>of</strong> around<br />
300% makes <strong>of</strong>fice space in Manchester more<br />
expensive than Manhattan (Cheshire & Hilber, 2008)<br />
• Successful British cities are too small and<br />
constraints on growth threaten to undermine<br />
competitive advantage<br />
• Spatial adjustment to globalization is inhibited
Full Relaxation <strong>of</strong> Planning Controls<br />
on House-Building<br />
• Average real English house-price down by 35%<br />
and equilibrium housing stock up by 17% (Hilber &<br />
Vermeulen, 2012; NHPAU, 2007)<br />
• 20-year transition entails 175K extra houses per<br />
year employing 750K (back to 1930s!)<br />
• Massive welfare gain makes it quite possible to<br />
incentivize local communities to like the idea<br />
(Leunig, 2007)<br />
• Tobin’s Q is high but need to disincentivize<br />
waiting for better time to build
What is the Most Effective Role for<br />
UK Government?<br />
• Good horizontal industrial policies and strong<br />
pro-competition stance; not back to the 1970s<br />
• Address market failures and remember CBA<br />
• Facilitate diffusion; don’t fixate on R & D<br />
• Recognize that wide set <strong>of</strong> government actions<br />
including regulation affect the attractiveness <strong>of</strong><br />
investment, innovation and technology adoption
Diffusion<br />
• Benefits <strong>of</strong> new technologies mainly (98%)<br />
from use not invention (Nordhaus, 2004)<br />
• Vast majority (89%) <strong>of</strong> new technology in UK<br />
comes from R & D in ROW (Eaton & Kortum, 1999)<br />
• Regulation and competition affect diffusion<br />
• Delays in adoption <strong>of</strong> new technologies can be<br />
very costly; e.g., cell phones in USA where<br />
regulatory delay caused S100 bn. consumer<br />
welfare losses (Hausman, 1997)
Sources <strong>of</strong> Growth in Real GDP/HW in the UK<br />
Market Sector, 1990-2008 (dal Borgo et al., 2012) (% per year)<br />
1990-95 1995-2000 2000-08<br />
Tangible Capital 0.95 0.74 0.67<br />
Labour Quality 0.17 0.25 0.16<br />
R & D 0.05 0.04 0.05<br />
Other Intangibles 0.58 0.63 0.47<br />
TFP 1.19 1.87 0.90<br />
Total 2.94 3.53 2.25
Top 6 Sectoral Contributions to UK<br />
Labour Productivity Growth, 1995-2007<br />
(Crafts, 2012) (% per year)<br />
Value-added<br />
share weight<br />
Growth Rate<br />
<strong>of</strong> Real GDP/HW<br />
Contribution<br />
Wholesale and Retail Trade 0.123 3.05 0.38<br />
Post & Telecommunications 0.030 9.00 0.28<br />
Business Services 0.220 1.06 0.23<br />
Financial Services 0.046 4.23 0.19<br />
Electrical and Optical<br />
Equipment<br />
0.021 6.64 0.14<br />
Transport & Storage 0.048 2.58 0.12
Wholesale and Retail Trade<br />
• Would be considered irrelevant by traditional<br />
industrial policy<br />
• Does not do much R & D (0.5% <strong>of</strong> UK R & D)<br />
but is the sector that contributed most to recent<br />
UK labour-productivity growth<br />
• Is a big user <strong>of</strong> new technology<br />
• Has been adversely affected by planning<br />
regulations; TFP in modern supermarkets<br />
reduced by at least 20% (Cheshire et al., 2011)
<strong>Policy</strong> Implications<br />
• Evidence-based supply-side reforms could<br />
improve productivity performance; e.g., tax,<br />
planning, transport<br />
• Planning rules matter for productivity as well as<br />
R & D subsidies<br />
• If there is more emphasis on industrial policy it<br />
should be designed with a view to minimizing<br />
the adverse effects on competition
Lessons (3)<br />
• The recovery is weak compared with the 1930s<br />
and 1980s after a credit boom and bust<br />
• There is limited scope to boost aggregate<br />
demand; need to act on supply-side<br />
• Fiscal consolidation could be made more<br />
productivity friendly<br />
• Radical supply-side reform delivered growth in<br />
the 1980s and could do so again even in the<br />
short term – if only politics allowed!