Formaldehyde Europe 2012 - Perstorp Formox
Formaldehyde Europe 2012 - Perstorp Formox
Formaldehyde Europe 2012 - Perstorp Formox

You also want an ePaper? Increase the reach of your titles
YUMPU automatically turns print PDFs into web optimized ePapers that Google loves.
<strong>Formaldehyde</strong> demand<br />
to 2020 & beyond<br />
As you will have seen elsewhere in this issue, <strong>Formaldehyde</strong> europe <strong>2012</strong> took place in May.<br />
The inaugural event, in 1994, was the first public presentation of my now customary technique<br />
of categorizing formaldehyde applications as either wood, plastics (now more broadly<br />
termed “chemicals”) or others.<br />
The reason for doing this was that the different<br />
market sectors had different drivers; factors influencing<br />
one sector did not necessarily impact<br />
on the other. This remains as true today as it did<br />
then. Indeed there is much that is the same;<br />
then, as now, we were coming out of recession.<br />
But back then the message was that the future<br />
would be bright; indeed the penultimate slide<br />
in the presentation all those years ago (Fig 1)<br />
said as much; but we will come back to that later.<br />
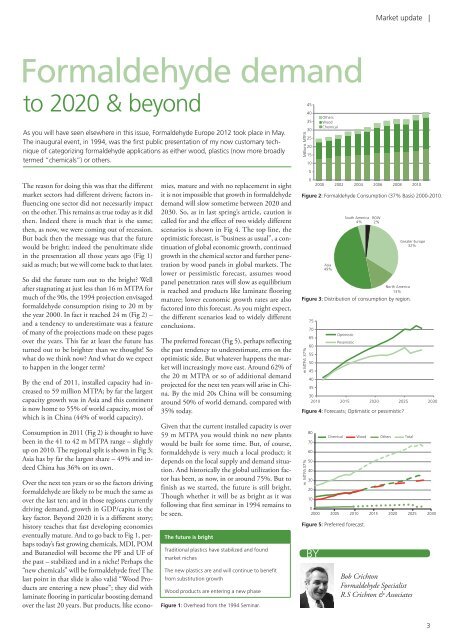
So did the future turn out to the bright? Well<br />
after stagnating at just less than 16 m MTPA for<br />
much of the 90s, the 1994 projection envisaged<br />
formaldehyde consumption rising to 20 m by<br />
the year 2000. In fact it reached 24 m (Fig 2) –<br />
and a tendency to underestimate was a feature<br />
of many of the projections made on these pages<br />
over the years. This far at least the future has<br />
turned out to be brighter than we thought! So<br />
what do we think now? And what do we expect<br />
to happen in the longer term?<br />
By the end of 2011, installed capacity had increased<br />
to 59 million MTPA; by far the largest<br />
capacity growth was in Asia and this continent<br />
is now home to 55% of world capacity, most of<br />
which is in China (44% of world capacity).<br />
Consumption in 2011 (Fig 2) is thought to have<br />
been in the 41 to 42 m MTPA range – slightly<br />
up on 2010. The regional split is shown in Fig 3;<br />
Asia has by far the largest share – 49% and indeed<br />
China has 36% on its own.<br />
Over the next ten years or so the factors driving<br />
formaldehyde are likely to be much the same as<br />
over the last ten; and in those regions currently<br />
driving demand, growth in GDP/capita is the<br />
key factor. Beyond 2020 it is a different story;<br />
history teaches that fast developing economies<br />
eventually mature. And to go back to Fig 1, perhaps<br />
today’s fast growing chemicals, MDI, POM<br />
and Butanediol will become the PF and UF of<br />
the past – stabilized and in a niche! Perhaps the<br />
“new chemicals” will be formaldehyde free! The<br />
last point in that slide is also valid “Wood Products<br />
are entering a new phase”; they did with<br />
laminate flooring in particular boosting demand<br />
over the last 20 years. But products, like econo-<br />
mies, mature and with no replacement in sight<br />
it is not impossible that growth in formaldehyde<br />
demand will slow sometime between 2020 and<br />
2030. So, as in last spring’s article, caution is<br />
called for and the effect of two widely different<br />
scenarios is shown in Fig 4. The top line, the<br />
optimistic forecast, is “business as usual”, a continuation<br />
of global economic growth, continued<br />
growth in the chemical sector and further penetration<br />
by wood panels in global markets. The<br />
lower or pessimistic forecast, assumes wood<br />
panel penetration rates will slow as equilibrium<br />
is reached and products like laminate flooring<br />
mature; lower economic growth rates are also<br />
factored into this forecast. As you might expect,<br />
the different scenarios lead to widely different<br />
conclusions.<br />
The preferred forecast (Fig 5), perhaps reflecting<br />
the past tendency to underestimate, errs on the<br />
optimistic side. But whatever happens the market<br />
will increasingly move east. Around 62% of<br />
the 20 m MTPA or so of additional demand<br />
projected for the next ten years will arise in China.<br />
By the mid 20s China will be consuming<br />
around 50% of world demand, compared with<br />
35% today.<br />
Given that the current installed capacity is over<br />
59 m MTPA you would think no new plants<br />
would be built for some time. But, of course,<br />
formaldehyde is very much a local product; it<br />
depends on the local supply and demand situation.<br />
And historically the global utilization factor<br />
has been, as now, in or around 75%. But to<br />
finish as we started, the future is still bright.<br />
Though whether it will be as bright as it was<br />
follow ing that first seminar in 1994 remains to<br />
be seen.<br />
The future is bright<br />
Traditional plastics have stabilized and found<br />
market niches<br />
The new plastics are and will continue to benefit<br />
from substitution growth<br />
Wood products are entering a new phase<br />
Figure 1: overhead from the 1994 Seminar.<br />
Millions MTPA<br />
BY<br />
Market update |<br />
45<br />
40<br />
Others<br />
35 Wood<br />
30<br />
25<br />
20<br />
15<br />
10<br />
5<br />
0<br />
Chemical<br />
2000 2002 2004 2006 2008 2010<br />
Figure 2: <strong>Formaldehyde</strong> consumption (37% Basis) 2000-2010.<br />
North America<br />
13%<br />
Figure 3: Distribution of consumption by region.<br />
75<br />
70<br />
65<br />
Optimistic<br />
60<br />
55<br />
50<br />
45<br />
40<br />
35<br />
30<br />
Pessimistic<br />
2010 2015 2020 2025 2030<br />
Figure 4: Forecasts; optimistic or pessimistic?<br />
m MTPA 37%<br />
m MTPA 37%<br />
80<br />
70<br />
60<br />
50<br />
40<br />
30<br />
20<br />
10<br />
Asia<br />
49%<br />
South America<br />
4%<br />
Chemical Wood Others Total<br />
0<br />
2000 2005 2010 2015 2020 2025 2030<br />
Figure 5: Preferred forecast.<br />
ROW<br />
2%<br />
Greater <strong>Europe</strong><br />
32%<br />
Bob Crichton<br />
<strong>Formaldehyde</strong> Specialist<br />
R.S Crichton & Associates<br />
3