
Create successful ePaper yourself
Turn your PDF publications into a flip-book with our unique Google optimized e-Paper software.
The China Module<br />
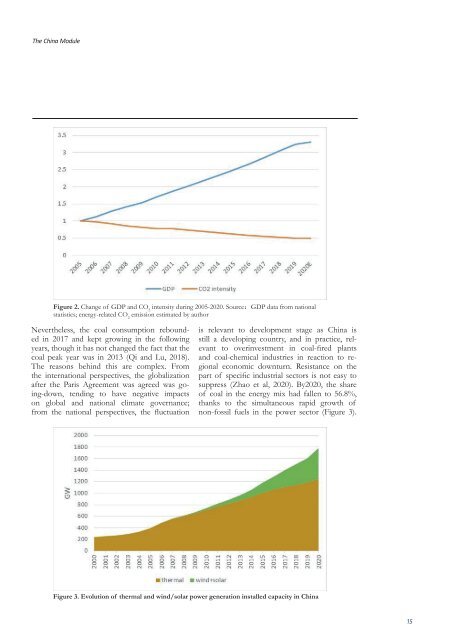
Figure 2. Change of GDP and CO 2<br />
intensity during 2005-2020. Source:GDP data from national<br />
statistics; energy-related CO 2<br />
emission estimated by author<br />
Nevertheless, the coal consumption rebounded<br />
in 2017 and kept growing in the following<br />
years, though it has not changed the fact that the<br />
coal peak year was in 2013 (Qi and Lu, 2018).<br />
The reasons behind this are complex. From<br />
the international perspectives, the globalization<br />
after the Paris Agreement was agreed was going-down,<br />
tending to have negative impacts<br />
on global and national climate governance;<br />
from the national perspectives, the fluctuation<br />
is relevant to development stage as China is<br />
still a developing country, and in practice, relevant<br />
to overinvestment in coal-fired plants<br />
and coal-chemical industries in reaction to regional<br />
economic downturn. Resistance on the<br />
part of specific industrial sectors is not easy to<br />
suppress (Zhao et al, 2020). By2020, the share<br />
of coal in the energy mix had fallen to 56.8%,<br />
thanks to the simultaneous rapid growth of<br />
non-fossil fuels in the power sector (Figure 3).<br />
Figure 3. Evolution of thermal and wind/solar power generation installed capacity in China<br />
15