- Page 3 and 4:
Algebra and Trigonometry SENIOR CON
- Page 5 and 6:
OpenStax OpenStax provides free, pe
- Page 8 and 9:
Study where you want, what you want
- Page 11 and 12:
Contents Preface vii 1 Prerequisite
- Page 13 and 14:
7 8 9 10 The Unit Circle: Sine and
- Page 15 and 16:
Preface Welcome to Algebra and Trig
- Page 17 and 18:
Pedagogical Foundations and Feature
- Page 19 and 20:
Prerequisites 1 Figure 1 Credit: An
- Page 21 and 22:
SECTION 1.1 REAL NUMBERS: ALGEBRA E
- Page 23 and 24:
SECTION 1.1 REAL NUMBERS: ALGEBRA E
- Page 25 and 26:
SECTION 1.1 REAL NUMBERS: ALGEBRA E
- Page 27 and 28:
SECTION 1.1 REAL NUMBERS: ALGEBRA E
- Page 29 and 30:
SECTION 1.1 REAL NUMBERS: ALGEBRA E
- Page 31 and 32:
SECTION 1.1 REAL NUMBERS: ALGEBRA E
- Page 33 and 34:
SECTION 1.1 SECTION EXERCISES 15 1.
- Page 35 and 36:
SECTION 1.2 EXPONENTS AND SCIENTIFI
- Page 37 and 38:
SECTION 1.2 EXPONENTS AND SCIENTIFI
- Page 39 and 40:
SECTION 1.2 EXPONENTS AND SCIENTIFI
- Page 41 and 42:
SECTION 1.2 EXPONENTS AND SCIENTIFI
- Page 43 and 44:
SECTION 1.2 EXPONENTS AND SCIENTIFI
- Page 45 and 46:
SECTION 1.2 EXPONENTS AND SCIENTIFI
- Page 47 and 48:
SECTION 1.2 SECTION EXERCISES 29 1.
- Page 49 and 50:
SECTION 1.3 RADICALS AND RATIONAL E
- Page 51 and 52:
SECTION 1.3 RADICALS AND RATIONAL E
- Page 53 and 54:
SECTION 1.3 RADICALS AND RATIONAL E
- Page 55 and 56:
SECTION 1.3 RADICALS AND RATIONAL E
- Page 57 and 58:
SECTION 1.3 SECTION EXERCISES 39 1.
- Page 59 and 60:
SECTION 1.4 POLYNOMIALS 41 LEARNING
- Page 61 and 62:
SECTION 1.4 POLYNOMIALS 43 How To
- Page 63 and 64:
SECTION 1.4 POLYNOMIALS 45 Example
- Page 65 and 66:
SECTION 1.4 POLYNOMIALS 47 Example
- Page 67 and 68:
SECTION 1.5 FACTORING POLYNOMIALS 4
- Page 69 and 70:
SECTION 1.5 FACTORING POLYNOMIALS 5
- Page 71 and 72:
SECTION 1.5 FACTORING POLYNOMIALS 5
- Page 73 and 74:
SECTION 1.5 FACTORING POLYNOMIALS 5
- Page 75 and 76:
SECTION 1.5 SECTION EXERCISES 57 RE
- Page 77 and 78:
SECTION 1.6 RATIONAL EXPRESSIONS 59
- Page 79 and 80:
SECTION 1.6 RATIONAL EXPRESSIONS 61
- Page 81 and 82:
SECTION 1.6 RATIONAL EXPRESSIONS 63
- Page 83 and 84:
SECTION 1.6 SECTION EXERCISES 65 Fo
- Page 85 and 86:
CHAPTER 1 REVIEW 67 monomial a poly
- Page 87 and 88:
CHAPTER 1 REVIEW 69 1.4 Polynomials
- Page 89 and 90:
CHAPTER 1 REVIEW 71 POLYNOMIALS For
- Page 91 and 92:
Equations and Inequalities 2 Figure
- Page 93 and 94:
SECTION 2.1 THE RECTANGULAR COORDIN
- Page 95 and 96:
SECTION 2.1 THE RECTANGULAR COORDIN
- Page 97 and 98:
SECTION 2.1 THE RECTANGULAR COORDIN
- Page 99 and 100:
SECTION 2.1 THE RECTANGULAR COORDIN
- Page 101 and 102:
SECTION 2.1 THE RECTANGULAR COORDIN
- Page 103 and 104:
SECTION 2.1 SECTION EXERCISES 85 32
- Page 105 and 106:
SECTION 2.2 LINEAR EQUATIONS IN ONE
- Page 107 and 108:
SECTION 2.2 LINEAR EQUATIONS IN ONE
- Page 109 and 110:
SECTION 2.2 LINEAR EQUATIONS IN ONE
- Page 111 and 112:
SECTION 2.2 LINEAR EQUATIONS IN ONE
- Page 113 and 114:
SECTION 2.2 LINEAR EQUATIONS IN ONE
- Page 115 and 116:
SECTION 2.2 LINEAR EQUATIONS IN ONE
- Page 117 and 118:
SECTION 2.2 LINEAR EQUATIONS IN ONE
- Page 119 and 120:
SECTION 2.2 SECTION EXERCISES 101 G
- Page 121 and 122:
SECTION 2.3 MODELS AND APPLICATIONS
- Page 123 and 124:
SECTION 2.3 MODELS AND APPLICATIONS
- Page 125 and 126:
SECTION 2.3 MODELS AND APPLICATIONS
- Page 127 and 128:
SECTION 2.3 SECTION EXERCISES 109 F
- Page 129 and 130:
SECTION 2.4 COMPLEX NUMBERS 111 LEA
- Page 131 and 132:
SECTION 2.4 COMPLEX NUMBERS 113 How
- Page 133 and 134:
SECTION 2.4 COMPLEX NUMBERS 115 How
- Page 135 and 136:
SECTION 2.4 COMPLEX NUMBERS 117 Sim
- Page 137 and 138:
SECTION 2.5 QUADRATIC EQUATIONS 119
- Page 139 and 140:
SECTION 2.5 QUADRATIC EQUATIONS 121
- Page 141 and 142:
SECTION 2.5 QUADRATIC EQUATIONS 123
- Page 143 and 144:
SECTION 2.5 QUADRATIC EQUATIONS 125
- Page 145 and 146:
SECTION 2.5 QUADRATIC EQUATIONS 127
- Page 147 and 148:
SECTION 2.5 SECTION EXERCISES 129 2
- Page 149 and 150:
SECTION 2.6 OTHER TYPES OF EQUATION
- Page 151 and 152:
SECTION 2.6 OTHER TYPES OF EQUATION
- Page 153 and 154:
SECTION 2.6 OTHER TYPES OF EQUATION
- Page 155 and 156:
SECTION 2.6 OTHER TYPES OF EQUATION
- Page 157 and 158:
SECTION 2.6 OTHER TYPES OF EQUATION
- Page 159 and 160:
SECTION 2.6 SECTION EXERCISES 141 2
- Page 161 and 162:
SECTION 2.7 LINEAR INEQUALITIES AND
- Page 163 and 164:
SECTION 2.7 LINEAR INEQUALITIES AND
- Page 165 and 166:
SECTION 2.7 LINEAR INEQUALITIES AND
- Page 167 and 168:
SECTION 2.7 SECTION EXERCISES 149 2
- Page 169 and 170:
CHAPTER 2 REVIEW 151 CHAPTER 2 REVI
- Page 171 and 172:
CHAPTER 2 REVIEW 153 We can identi
- Page 173 and 174:
CHAPTER 2 REVIEW 155 CHAPTER 2 REVI
- Page 175 and 176:
CHAPTER 2 REVIEW 157 OTHER TYPES OF
- Page 177 and 178:
3 Functions 1,500 P y 1,000 500 0 1
- Page 179 and 180:
SECTION 3.1 FUNCTIONS AND FUNCTION
- Page 181 and 182:
SECTION 3.1 FUNCTIONS AND FUNCTION
- Page 183 and 184:
SECTION 3.1 FUNCTIONS AND FUNCTION
- Page 185 and 186:
SECTION 3.1 FUNCTIONS AND FUNCTION
- Page 187 and 188:
SECTION 3.1 FUNCTIONS AND FUNCTION
- Page 189 and 190:
SECTION 3.1 FUNCTIONS AND FUNCTION
- Page 191 and 192:
SECTION 3.1 FUNCTIONS AND FUNCTION
- Page 193 and 194:
SECTION 3.1 FUNCTIONS AND FUNCTION
- Page 195 and 196:
SECTION 3.1 SECTION EXERCISES 177 G
- Page 197 and 198:
SECTION 3.1 SECTION EXERCISES 179 F
- Page 199 and 200:
SECTION 3.2 DOMAIN AND RANGE 181 Le
- Page 201 and 202:
SECTION 3.2 DOMAIN AND RANGE 183 Ex
- Page 203 and 204:
SECTION 3.2 DOMAIN AND RANGE 185 Tr
- Page 205 and 206:
SECTION 3.2 DOMAIN AND RANGE 187 Fi
- Page 207 and 208:
SECTION 3.2 DOMAIN AND RANGE 189 Ex
- Page 209 and 210:
SECTION 3.2 DOMAIN AND RANGE 191 An
- Page 211 and 212:
SECTION 3.2 SECTION EXERCISES 193 3
- Page 213 and 214:
SECTION 3.2 SECTION EXERCISES 195 N
- Page 215 and 216:
SECTION 3.3 RATES OF CHANGE AND BEH
- Page 217 and 218:
SECTION 3.3 RATES OF CHANGE AND BEH
- Page 219 and 220:
SECTION 3.3 RATES OF CHANGE AND BEH
- Page 221 and 222:
SECTION 3.3 RATES OF CHANGE AND BEH
- Page 223 and 224:
SECTION 3.3 RATES OF CHANGE AND BEH
- Page 225 and 226:
SECTION 3.3 SECTION EXERCISES 207 2
- Page 227 and 228:
SECTION 3.4 COMPOSITION OF FUNCTION
- Page 229 and 230:
SECTION 3.4 COMPOSITION OF FUNCTION
- Page 231 and 232:
SECTION 3.4 COMPOSITION OF FUNCTION
- Page 233 and 234:
SECTION 3.4 COMPOSITION OF FUNCTION
- Page 235 and 236:
SECTION 3.4 COMPOSITION OF FUNCTION
- Page 237 and 238:
SECTION 3.4 SECTION EXERCISES 219 2
- Page 239 and 240:
SECTION 3.4 SECTION EXERCISES 221 E
- Page 241 and 242:
SECTION 3.5 TRANSFORMATION OF FUNCT
- Page 243 and 244:
SECTION 3.5 TRANSFORMATION OF FUNCT
- Page 245 and 246:
SECTION 3.5 TRANSFORMATION OF FUNCT
- Page 247 and 248:
SECTION 3.5 TRANSFORMATION OF FUNCT
- Page 249 and 250:
SECTION 3.5 TRANSFORMATION OF FUNCT
- Page 251 and 252:
SECTION 3.5 TRANSFORMATION OF FUNCT
- Page 253 and 254:
SECTION 3.5 TRANSFORMATION OF FUNCT
- Page 255 and 256:
SECTION 3.5 TRANSFORMATION OF FUNCT
- Page 257 and 258:
SECTION 3.5 TRANSFORMATION OF FUNCT
- Page 259 and 260:
SECTION 3.5 TRANSFORMATION OF FUNCT
- Page 261 and 262:
SECTION 3.5 SECTION EXERCISES 243 3
- Page 263 and 264:
SECTION 3.5 SECTION EXERCISES 245 3
- Page 265 and 266:
SECTION 3.6 ABSOLUTE VALUE FUNCTION
- Page 267 and 268:
SECTION 3.6 ABSOLUTE VALUE FUNCTION
- Page 269 and 270:
SECTION 3.6 ABSOLUTE VALUE FUNCTION
- Page 271 and 272:
SECTION 3.6 SECTION EXERCISES 253 T
- Page 273 and 274:
SECTION 3.7 INVERSE FUNCTIONS 255 A
- Page 275 and 276:
SECTION 3.7 INVERSE FUNCTIONS 257 E
- Page 277 and 278:
SECTION 3.7 INVERSE FUNCTIONS 259 F
- Page 279 and 280:
SECTION 3.7 INVERSE FUNCTIONS 261 S
- Page 281 and 282:
SECTION 3.7 INVERSE FUNCTIONS 263 y
- Page 283 and 284:
SECTION 3.7 SECTION EXERCISES 265 F
- Page 285 and 286:
CHAPTER 3 REVIEW 267 CHAPTER 3 REVI
- Page 287 and 288:
CHAPTER 3 REVIEW 269 Key Concepts 3
- Page 289 and 290:
CHAPTER 3 REVIEW 271 The order in
- Page 291 and 292:
CHAPTER 3 REVIEW 273 For the follow
- Page 293 and 294:
CHAPTER 3 REVIEW 275 For the follow
- Page 295 and 296:
CHAPTER 3 PRACTICE TEST 277 CHAPTER
- Page 297 and 298:
4 Linear Functions CHAPTER OUTLINE
- Page 299 and 300:
SECTION 4.1 LINEAR FUNCTIONS 281 Re
- Page 301 and 302:
SECTION 4.1 LINEAR FUNCTIONS 283 in
- Page 303 and 304:
SECTION 4.1 LINEAR FUNCTIONS 285 Tr
- Page 305 and 306:
SECTION 4.1 LINEAR FUNCTIONS 287 We
- Page 307 and 308:
SECTION 4.1 LINEAR FUNCTIONS 289 Ex
- Page 309 and 310:
SECTION 4.1 LINEAR FUNCTIONS 291 f(
- Page 311 and 312:
SECTION 4.1 LINEAR FUNCTIONS 293 y
- Page 313 and 314:
SECTION 4.1 LINEAR FUNCTIONS 295 Ho
- Page 315 and 316:
SECTION 4.1 LINEAR FUNCTIONS 297 y
- Page 317 and 318:
SECTION 4.1 LINEAR FUNCTIONS 299 f
- Page 319 and 320:
SECTION 4.1 LINEAR FUNCTIONS 301 So
- Page 321 and 322:
SECTION 4.1 LINEAR FUNCTIONS 303 Ex
- Page 323 and 324:
SECTION 4.1 SECTION EXERCISES 305 F
- Page 325 and 326:
SECTION 4.1 SECTION EXERCISES 307 N
- Page 327 and 328:
SECTION 4.2 MODELING WITH LINEAR FU
- Page 329 and 330:
SECTION 4.2 MODELING WITH LINEAR FU
- Page 331 and 332:
SECTION 4.2 MODELING WITH LINEAR FU
- Page 333 and 334:
SECTION 4.2 MODELING WITH LINEAR FU
- Page 335 and 336:
SECTION 4.2 SECTION EXERCISES 317 4
- Page 337 and 338:
SECTION 4.2 SECTION EXERCISES 319 F
- Page 339 and 340:
SECTION 4.2 SECTION EXERCISES 321 5
- Page 341 and 342:
SECTION 4.3 FITTING LINEAR MODELS T
- Page 343 and 344:
SECTION 4.3 FITTING LINEAR MODELS T
- Page 345 and 346:
SECTION 4.3 FITTING LINEAR MODELS T
- Page 347 and 348:
SECTION 4.3 SECTION EXERCISES 329 4
- Page 349 and 350:
SECTION 4.3 SECTION EXERCISES 331 2
- Page 351 and 352:
SECTION 4.3 SECTION EXERCISES 333 R
- Page 353 and 354:
CHAPTER 4 REVIEW 335 Vertical line
- Page 355 and 356:
CHAPTER 4 REVIEW 337 For the follow
- Page 357 and 358:
CHAPTER 4 REVIEW 339 For the follow
- Page 359 and 360:
CHAPTER 4 PRACTICE TEST 341 15. Wri
- Page 361 and 362:
Polynomial and Rational Functions 5
- Page 363 and 364:
SECTION 5.1 QUADRATIC FUNCTIONS 345
- Page 365 and 366:
SECTION 5.1 QUADRATIC FUNCTIONS 347
- Page 367 and 368:
SECTION 5.1 QUADRATIC FUNCTIONS 349
- Page 369 and 370:
SECTION 5.1 QUADRATIC FUNCTIONS 351
- Page 371 and 372:
SECTION 5.1 QUADRATIC FUNCTIONS 353
- Page 373 and 374:
SECTION 5.1 QUADRATIC FUNCTIONS 355
- Page 375 and 376:
SECTION 5.1 SECTION EXERCISES 357 5
- Page 377 and 378:
SECTION 5.1 SECTION EXERCISES 359 E
- Page 379 and 380:
SECTION 5.2 POWER FUNCTIONS AND POL
- Page 381 and 382:
SECTION 5.2 POWER FUNCTIONS AND POL
- Page 383 and 384:
SECTION 5.2 POWER FUNCTIONS AND POL
- Page 385 and 386:
SECTION 5.2 POWER FUNCTIONS AND POL
- Page 387 and 388:
SECTION 5.2 POWER FUNCTIONS AND POL
- Page 389 and 390:
SECTION 5.2 POWER FUNCTIONS AND POL
- Page 391 and 392:
SECTION 5.2 SECTION EXERCISES 373 3
- Page 393 and 394:
SECTION 5.3 GRAPHS OF POLYNOMIAL FU
- Page 395 and 396:
SECTION 5.3 GRAPHS OF POLYNOMIAL FU
- Page 397 and 398:
SECTION 5.3 GRAPHS OF POLYNOMIAL FU
- Page 399 and 400:
SECTION 5.3 GRAPHS OF POLYNOMIAL FU
- Page 401 and 402:
SECTION 5.3 GRAPHS OF POLYNOMIAL FU
- Page 403 and 404:
SECTION 5.3 GRAPHS OF POLYNOMIAL FU
- Page 405 and 406:
SECTION 5.3 GRAPHS OF POLYNOMIAL FU
- Page 407 and 408:
SECTION 5.3 GRAPHS OF POLYNOMIAL FU
- Page 409 and 410:
SECTION 5.3 SECTION EXERCISES 391 F
- Page 411 and 412:
SECTION 5.4 DIVIDING POLYNOMIALS 39
- Page 413 and 414:
SECTION 5.4 DIVIDING POLYNOMIALS 39
- Page 415 and 416:
SECTION 5.4 DIVIDING POLYNOMIALS 39
- Page 417 and 418:
SECTION 5.4 DIVIDING POLYNOMIALS 39
- Page 419 and 420:
SECTION 5.4 SECTION EXERCISES 401 4
- Page 421 and 422:
SECTION 5.5 ZEROS OF POLYNOMIAL FUN
- Page 423 and 424:
SECTION 5.5 ZEROS OF POLYNOMIAL FUN
- Page 425 and 426:
SECTION 5.5 ZEROS OF POLYNOMIAL FUN
- Page 427 and 428:
Example 7 SECTION 5.5 ZEROS OF POLY
- Page 429 and 430:
SECTION 5.5 ZEROS OF POLYNOMIAL FUN
- Page 431 and 432:
SECTION 5.5 SECTION EXERCISES 413 5
- Page 433 and 434:
SECTION 5.6 RATIONAL FUNCTIONS 415
- Page 435 and 436:
SECTION 5.6 RATIONAL FUNCTIONS 417
- Page 437 and 438:
SECTION 5.6 RATIONAL FUNCTIONS 419
- Page 439 and 440:
SECTION 5.6 RATIONAL FUNCTIONS 421
- Page 441 and 442:
SECTION 5.6 RATIONAL FUNCTIONS 423
- Page 443 and 444:
SECTION 5.6 RATIONAL FUNCTIONS 425
- Page 445 and 446:
SECTION 5.6 RATIONAL FUNCTIONS 427
- Page 447 and 448:
SECTION 5.6 RATIONAL FUNCTIONS 429
- Page 449 and 450: SECTION 5.6 SECTION EXERCISES 431 5
- Page 451 and 452: SECTION 5.6 SECTION EXERCISES 433 6
- Page 453 and 454: SECTION 5.7 INVERSES AND RADICAL FU
- Page 455 and 456: SECTION 5.7 INVERSES AND RADICAL FU
- Page 457 and 458: SECTION 5.7 INVERSES AND RADICAL FU
- Page 459 and 460: SECTION 5.7 INVERSES AND RADICAL FU
- Page 461 and 462: SECTION 5.7 INVERSES AND RADICAL FU
- Page 463 and 464: SECTION 5.7 SECTION EXERCISES 445 T
- Page 465 and 466: SECTION 5.8 MODELING USING VARIATIO
- Page 467 and 468: SECTION 5.8 MODELING USING VARIATIO
- Page 469 and 470: SECTION 5.8 SECTION EXERCISES 451 5
- Page 471 and 472: CHAPTER 5 REVIEW 453 CHAPTER 5 REVI
- Page 473 and 474: CHAPTER 5 REVIEW 455 Key Concepts 5
- Page 475 and 476: CHAPTER 5 REVIEW 457 See Example 12
- Page 477 and 478: CHAPTER 5 REVIEW 459 18. Use the In
- Page 479 and 480: CHAPTER 5 PRACTICE TEST 461 CHAPTER
- Page 481 and 482: Exponential and Logarithmic Functio
- Page 483 and 484: SECTION 6.1 EXPONENTIAL FUNCTIONS 4
- Page 485 and 486: SECTION 6.1 EXPONENTIAL FUNCTIONS 4
- Page 487 and 488: SECTION 6.1 EXPONENTIAL FUNCTIONS 4
- Page 489 and 490: SECTION 6.1 EXPONENTIAL FUNCTIONS 4
- Page 491 and 492: SECTION 6.1 EXPONENTIAL FUNCTIONS 4
- Page 493 and 494: SECTION 6.1 EXPONENTIAL FUNCTIONS 4
- Page 495 and 496: SECTION 6.1 SECTION EXERCISES 477 F
- Page 497 and 498: SECTION 6.2 GRAPHS OF EXPONENTIAL F
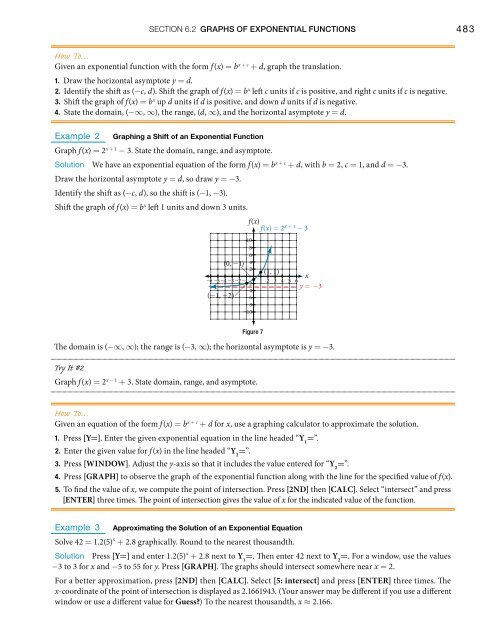
- Page 499: SECTION 6.2 GRAPHS OF EXPONENTIAL F
- Page 503 and 504: SECTION 6.2 GRAPHS OF EXPONENTIAL F
- Page 505 and 506: SECTION 6.2 GRAPHS OF EXPONENTIAL F
- Page 507 and 508: SECTION 6.2 SECTION EXERCISES 489 F
- Page 509 and 510: SECTION 6.3 LOGARITHMIC FUNCTIONS 4
- Page 511 and 512: SECTION 6.3 LOGARITHMIC FUNCTIONS 4
- Page 513 and 514: SECTION 6.3 LOGARITHMIC FUNCTIONS 4
- Page 515 and 516: SECTION 6.3 SECTION EXERCISES 497 6
- Page 517 and 518: SECTION 6.4 GRAPHS OF LOGARITHMIC F
- Page 519 and 520: SECTION 6.4 GRAPHS OF LOGARITHMIC F
- Page 521 and 522: SECTION 6.4 GRAPHS OF LOGARITHMIC F
- Page 523 and 524: SECTION 6.4 GRAPHS OF LOGARITHMIC F
- Page 525 and 526: SECTION 6.4 GRAPHS OF LOGARITHMIC F
- Page 527 and 528: SECTION 6.4 GRAPHS OF LOGARITHMIC F
- Page 529 and 530: SECTION 6.4 GRAPHS OF LOGARITHMIC F
- Page 531 and 532: SECTION 6.4 SECTION EXERCISES 513 6
- Page 533 and 534: SECTION 6.4 SECTION EXERCISES 515 4
- Page 535 and 536: SECTION 6.5 LOGARITHMIC PROPERTIES
- Page 537 and 538: SECTION 6.5 LOGARITHMIC PROPERTIES
- Page 539 and 540: SECTION 6.5 LOGARITHMIC PROPERTIES
- Page 541 and 542: SECTION 6.5 LOGARITHMIC PROPERTIES
- Page 543 and 544: SECTION 6.5 SECTION EXERCISES 525 6
- Page 545 and 546: SECTION 6.6 EXPONENTIAL AND LOGARIT
- Page 547 and 548: SECTION 6.6 EXPONENTIAL AND LOGARIT
- Page 549 and 550: SECTION 6.6 EXPONENTIAL AND LOGARIT
- Page 551 and 552:
SECTION 6.6 EXPONENTIAL AND LOGARIT
- Page 553 and 554:
SECTION 6.6 SECTION EXERCISES 535 6
- Page 555 and 556:
SECTION 6.7 EXPONENTIAL AND LOGARIT
- Page 557 and 558:
SECTION 6.7 EXPONENTIAL AND LOGARIT
- Page 559 and 560:
SECTION 6.7 EXPONENTIAL AND LOGARIT
- Page 561 and 562:
SECTION 6.7 EXPONENTIAL AND LOGARIT
- Page 563 and 564:
SECTION 6.7 EXPONENTIAL AND LOGARIT
- Page 565 and 566:
SECTION 6.7 EXPONENTIAL AND LOGARIT
- Page 567 and 568:
SECTION 6.7 SECTION EXERCISES 549 6
- Page 569 and 570:
SECTION 6.7 SECTION EXERCISES 551 F
- Page 571 and 572:
SECTION 6.8 FITTING EXPONENTIAL MOD
- Page 573 and 574:
SECTION 6.8 FITTING EXPONENTIAL MOD
- Page 575 and 576:
SECTION 6.8 FITTING EXPONENTIAL MOD
- Page 577 and 578:
SECTION 6.8 FITTING EXPONENTIAL MOD
- Page 579 and 580:
SECTION 6.8 SECTION EXERCISES 561 6
- Page 581 and 582:
SECTION 6.8 SECTION EXERCISES 563 F
- Page 583 and 584:
CHAPTER 6 REVIEW 565 CHAPTER 6 REVI
- Page 585 and 586:
CHAPTER 6 REVIEW 567 6.2 Graphs of
- Page 587 and 588:
CHAPTER 6 REVIEW 569 When given an
- Page 589 and 590:
CHAPTER 6 REVIEW 571 21. Evaluate l
- Page 591 and 592:
CHAPTER 6 PRACTICE TEST 573 CHAPTER
- Page 593 and 594:
7 The Unit Circle: Sine and Cosine
- Page 595 and 596:
SECTION 7.1 ANGLES 577 Angle creati
- Page 597 and 598:
SECTION 7.1 ANGLES 579 b. Divide th
- Page 599 and 600:
SECTION 7.1 ANGLES 581 45° π 45°
- Page 601 and 602:
SECTION 7.1 ANGLES 583 converting b
- Page 603 and 604:
SECTION 7.1 ANGLES 585 How To… Gi
- Page 605 and 606:
SECTION 7.1 ANGLES 587 arc length o
- Page 607 and 608:
SECTION 7.1 ANGLES 589 Angular spee
- Page 609 and 610:
SECTION 7.1 SECTION EXERCISES 591 7
- Page 611 and 612:
SECTION 7.2 RIGHT TRIANGLE TRIGONOM
- Page 613 and 614:
SECTION 7.2 RIGHT TRIANGLE TRIGONOM
- Page 615 and 616:
SECTION 7.2 RIGHT TRIANGLE TRIGONOM
- Page 617 and 618:
SECTION 7.2 RIGHT TRIANGLE TRIGONOM
- Page 619 and 620:
SECTION 7.2 SECTION EXERCISES 601 7
- Page 621 and 622:
SECTION 7.2 SECTION EXERCISES 603 4
- Page 623 and 624:
SECTION 7.3 UNIT CIRCLE 605 unit ci
- Page 625 and 626:
SECTION 7.3 UNIT CIRCLE 607 Try It
- Page 627 and 628:
SECTION 7.3 UNIT CIRCLE 609 At t =
- Page 629 and 630:
SECTION 7.3 UNIT CIRCLE 611 At t =
- Page 631 and 632:
SECTION 7.3 UNIT CIRCLE 613 II I II
- Page 633 and 634:
SECTION 7.3 UNIT CIRCLE 615 Example
- Page 635 and 636:
SECTION 7.3 SECTION EXERCISES 617 7
- Page 637 and 638:
SECTION 7.3 SECTION EXERCISES 619 7
- Page 639 and 640:
SECTION 7.4 THE OTHER TRIGONOMETRIC
- Page 641 and 642:
SECTION 7.4 THE OTHER TRIGONOMETRIC
- Page 643 and 644:
SECTION 7.4 THE OTHER TRIGONOMETRIC
- Page 645 and 646:
SECTION 7.4 THE OTHER TRIGONOMETRIC
- Page 647 and 648:
SECTION 7.4 THE OTHER TRIGONOMETRIC
- Page 649 and 650:
SECTION 7.4 SECTION EXERCISES 631 7
- Page 651 and 652:
CHAPTER 7 REVIEW 633 CHAPTER 7 REVI
- Page 653 and 654:
CHAPTER 7 REVIEW 635 Key Concepts 7
- Page 655 and 656:
CHAPTER 7 REVIEW 637 CHAPTER 7 REVI
- Page 657:
CHAPTER 7 PRACTICE TEST 639 CHAPTER
- Page 660 and 661:
642 CHAPTER 8 PERIODIC FUNCTIONS LE
- Page 662 and 663:
644 CHAPTER 8 PERIODIC FUNCTIONS Lo
- Page 664 and 665:
646 CHAPTER 8 PERIODIC FUNCTIONS y
- Page 666 and 667:
648 CHAPTER 8 PERIODIC FUNCTIONS In
- Page 668 and 669:
650 CHAPTER 8 PERIODIC FUNCTIONS Ex
- Page 670 and 671:
652 CHAPTER 8 PERIODIC FUNCTIONS Tr
- Page 672 and 673:
654 CHAPTER 8 PERIODIC FUNCTIONS An
- Page 674 and 675:
656 CHAPTER 8 PERIODIC FUNCTIONS 8.
- Page 676 and 677:
658 CHAPTER 8 PERIODIC FUNCTIONS AL
- Page 678 and 679:
660 CHAPTER 8 PERIODIC FUNCTIONS x
- Page 680 and 681:
662 CHAPTER 8 PERIODIC FUNCTIONS 4
- Page 682 and 683:
664 CHAPTER 8 PERIODIC FUNCTIONS So
- Page 684 and 685:
666 CHAPTER 8 PERIODIC FUNCTIONS pe
- Page 686 and 687:
668 CHAPTER 8 PERIODIC FUNCTIONS St
- Page 688 and 689:
670 CHAPTER 8 PERIODIC FUNCTIONS An
- Page 690 and 691:
672 CHAPTER 8 PERIODIC FUNCTIONS Ho
- Page 692 and 693:
674 CHAPTER 8 PERIODIC FUNCTIONS 8.
- Page 694 and 695:
676 CHAPTER 8 PERIODIC FUNCTIONS RE
- Page 696 and 697:
678 CHAPTER 8 PERIODIC FUNCTIONS Fi
- Page 698 and 699:
680 CHAPTER 8 PERIODIC FUNCTIONS So
- Page 700 and 701:
682 CHAPTER 8 PERIODIC FUNCTIONS Fi
- Page 702 and 703:
684 CHAPTER 8 PERIODIC FUNCTIONS Tr
- Page 704 and 705:
686 CHAPTER 8 PERIODIC FUNCTIONS 8.
- Page 706 and 707:
688 CHAPTER 8 PERIODIC FUNCTIONS CH
- Page 708 and 709:
690 CHAPTER 8 PERIODIC FUNCTIONS CH
- Page 710 and 711:
692 CHAPTER 8 PERIODIC FUNCTIONS CH
- Page 713 and 714:
9 Trigonometric Identities and Equa
- Page 715 and 716:
SECTION 9.1 SOLVING TRIGONOMETRIC E
- Page 717 and 718:
SECTION 9.1 SOLVING TRIGONOMETRIC E
- Page 719 and 720:
SECTION 9.1 SOLVING TRIGONOMETRIC E
- Page 721 and 722:
SECTION 9.1 SOLVING TRIGONOMETRIC E
- Page 723 and 724:
SECTION 9.1 SECTION EXERCISES 705 E
- Page 725 and 726:
SECTION 9.2 SUM AND DIFFERENCE IDEN
- Page 727 and 728:
SECTION 9.2 SUM AND DIFFERENCE IDEN
- Page 729 and 730:
SECTION 9.2 SUM AND DIFFERENCE IDEN
- Page 731 and 732:
SECTION 9.2 SUM AND DIFFERENCE IDEN
- Page 733 and 734:
SECTION 9.2 SUM AND DIFFERENCE IDEN
- Page 735 and 736:
SECTION 9.2 SUM AND DIFFERENCE IDEN
- Page 737 and 738:
SECTION 9.2 SECTION EXERCISES 719 G
- Page 739 and 740:
SECTION 9.3 DOUBLE-ANGLE, HALF-ANGL
- Page 741 and 742:
SECTION 9.3 DOUBLE-ANGLE, HALF-ANGL
- Page 743 and 744:
SECTION 9.3 DOUBLE-ANGLE, HALF-ANGL
- Page 745 and 746:
SECTION 9.3 DOUBLE-ANGLE, HALF-ANGL
- Page 747 and 748:
SECTION 9.3 DOUBLE-ANGLE, HALF-ANGL
- Page 749 and 750:
SECTION 9.3 SECTION EXERCISES 731 F
- Page 751 and 752:
SECTION 9.4 SUM-TO-PRODUCT AND PROD
- Page 753 and 754:
SECTION 9.4 SUM-TO-PRODUCT AND PROD
- Page 755 and 756:
SECTION 9.4 SECTION EXERCISES 737 9
- Page 757 and 758:
SECTION 9.5 SOLVING TRIGONOMETRIC E
- Page 759 and 760:
SECTION 9.5 SOLVING TRIGONOMETRIC E
- Page 761 and 762:
SECTION 9.5 SOLVING TRIGONOMETRIC E
- Page 763 and 764:
SECTION 9.5 SOLVING TRIGONOMETRIC E
- Page 765 and 766:
SECTION 9.5 SOLVING TRIGONOMETRIC E
- Page 767 and 768:
SECTION 9.5 SOLVING TRIGONOMETRIC E
- Page 769 and 770:
SECTION 9.5 SECTION EXERCISES 751 F
- Page 771 and 772:
CHAPTER 9 REVIEW 753 CHAPTER 9 REVI
- Page 773 and 774:
CHAPTER 9 REVIEW 755 Product-to-sum
- Page 775 and 776:
CHAPTER 9 REVIEW 757 CHAPTER 9 REVI
- Page 777 and 778:
CHAPTER 9 PRACTICE TEST 759 CHAPTER
- Page 779 and 780:
10 Further Applications of Trigonom
- Page 781 and 782:
SECTION 10.1 NON-RIGHT TRIANGLES: L
- Page 783 and 784:
SECTION 10.1 NON-RIGHT TRIANGLES: L
- Page 785 and 786:
SECTION 10.1 NON-RIGHT TRIANGLES: L
- Page 787 and 788:
SECTION 10.1 NON-RIGHT TRIANGLES: L
- Page 789 and 790:
SECTION 10.1 SECTION EXERCISES 771
- Page 791 and 792:
SECTION 10.1 SECTION EXERCISES 773
- Page 793 and 794:
SECTION 10.1 SECTION EXERCISES 775
- Page 795 and 796:
SECTION 10.2 NON-RIGHT TRIANGLES: L
- Page 797 and 798:
SECTION 10.2 NON-RIGHT TRIANGLES: L
- Page 799 and 800:
SECTION 10.2 NON-RIGHT TRIANGLES: L
- Page 801 and 802:
SECTION 10.2 SECTION EXERCISES 783
- Page 803 and 804:
SECTION 10.2 SECTION EXERCISES 785
- Page 805 and 806:
SECTION 10.2 SECTION EXERCISES 787
- Page 807 and 808:
SECTION 10.3 POLAR COORDINATES 789
- Page 809 and 810:
SECTION 10.3 POLAR COORDINATES 791
- Page 811 and 812:
SECTION 10.3 POLAR COORDINATES 793
- Page 813 and 814:
SECTION 10.3 POLAR COORDINATES 795
- Page 815 and 816:
SECTION 10.3 SECTION EXERCISES 797
- Page 817 and 818:
SECTION 10.4 POLAR COORDINATES: GRA
- Page 819 and 820:
SECTION 10.4 POLAR COORDINATES: GRA
- Page 821 and 822:
SECTION 10.4 POLAR COORDINATES: GRA
- Page 823 and 824:
SECTION 10.4 POLAR COORDINATES: GRA
- Page 825 and 826:
SECTION 10.4 POLAR COORDINATES: GRA
- Page 827 and 828:
SECTION 10.4 POLAR COORDINATES: GRA
- Page 829 and 830:
SECTION 10.4 POLAR COORDINATES: GRA
- Page 831 and 832:
SECTION 10.4 SECTION EXERCISES 813
- Page 833 and 834:
SECTION 10.5 POLAR FORM OF COMPLEX
- Page 835 and 836:
SECTION 10.5 POLAR FORM OF COMPLEX
- Page 837 and 838:
SECTION 10.5 POLAR FORM OF COMPLEX
- Page 839 and 840:
SECTION 10.5 POLAR FORM OF COMPLEX
- Page 841 and 842:
SECTION 10.5 POLAR FORM OF COMPLEX
- Page 843 and 844:
SECTION 10.5 SECTION EXERCISES 825
- Page 845 and 846:
SECTION 10.6 PARAMETRIC EQUATIONS 8
- Page 847 and 848:
SECTION 10.6 PARAMETRIC EQUATIONS 8
- Page 849 and 850:
SECTION 10.6 PARAMETRIC EQUATIONS 8
- Page 851 and 852:
SECTION 10.6 PARAMETRIC EQUATIONS 8
- Page 853 and 854:
SECTION 10.6 SECTION EXERCISES 835
- Page 855 and 856:
SECTION 10.7 PARAMETRIC EQUATIONS:
- Page 857 and 858:
SECTION 10.7 PARAMETRIC EQUATIONS:
- Page 859 and 860:
SECTION 10.7 PARAMETRIC EQUATIONS:
- Page 861 and 862:
SECTION 10.7 PARAMETRIC EQUATIONS:
- Page 863 and 864:
SECTION 10.7 SECTION EXERCISES 845
- Page 865 and 866:
SECTION 10.8 VECTORS 847 LEARNING O
- Page 867 and 868:
SECTION 10.8 VECTORS 849 y 5 (4, 5)
- Page 869 and 870:
SECTION 10.8 VECTORS 851 y Position
- Page 871 and 872:
SECTION 10.8 VECTORS 853 Try It #2
- Page 873 and 874:
SECTION 10.8 VECTORS 855 the unit v
- Page 875 and 876:
SECTION 10.8 VECTORS 857 Example 12
- Page 877 and 878:
SECTION 10.8 VECTORS 859 Example 16
- Page 879 and 880:
SECTION 10.8 SECTION EXERCISES 861
- Page 881 and 882:
SECTION 10.8 SECTION EXERCISES 863
- Page 883 and 884:
CHAPTER 10 REVIEW 865 CHAPTER 10 RE
- Page 885 and 886:
CHAPTER 10 REVIEW 867 There are th
- Page 887 and 888:
CHAPTER 10 REVIEW 869 10.7 Parametr
- Page 889 and 890:
CHAPTER 10 REVIEW 871 POLAR COORDIN
- Page 891:
CHAPTER 10 PRACTICE TEST 873 CHAPTE
- Page 894 and 895:
876 CHAPTER 11 SYSTEMS OF EQUATIONS
- Page 896 and 897:
878 CHAPTER 11 SYSTEMS OF EQUATIONS
- Page 898 and 899:
880 CHAPTER 11 SYSTEMS OF EQUATIONS
- Page 900 and 901:
882 CHAPTER 11 SYSTEMS OF EQUATIONS
- Page 902 and 903:
884 CHAPTER 11 SYSTEMS OF EQUATIONS
- Page 904 and 905:
886 CHAPTER 11 SYSTEMS OF EQUATIONS
- Page 906 and 907:
888 CHAPTER 11 SYSTEMS OF EQUATIONS
- Page 908 and 909:
890 CHAPTER 11 SYSTEMS OF EQUATIONS
- Page 910 and 911:
892 CHAPTER 11 SYSTEMS OF EQUATIONS
- Page 912 and 913:
894 CHAPTER 11 SYSTEMS OF EQUATIONS
- Page 914 and 915:
896 CHAPTER 11 SYSTEMS OF EQUATIONS
- Page 916 and 917:
898 CHAPTER 11 SYSTEMS OF EQUATIONS
- Page 918 and 919:
900 CHAPTER 11 SYSTEMS OF EQUATIONS
- Page 920 and 921:
902 CHAPTER 11 SYSTEMS OF EQUATIONS
- Page 922 and 923:
904 CHAPTER 11 SYSTEMS OF EQUATIONS
- Page 924 and 925:
906 CHAPTER 11 SYSTEMS OF EQUATIONS
- Page 926 and 927:
908 CHAPTER 11 SYSTEMS OF EQUATIONS
- Page 928 and 929:
910 CHAPTER 11 SYSTEMS OF EQUATIONS
- Page 930 and 931:
912 CHAPTER 11 SYSTEMS OF EQUATIONS
- Page 932 and 933:
914 CHAPTER 11 SYSTEMS OF EQUATIONS
- Page 934 and 935:
916 CHAPTER 11 SYSTEMS OF EQUATIONS
- Page 936 and 937:
918 CHAPTER 11 SYSTEMS OF EQUATIONS
- Page 938 and 939:
920 CHAPTER 11 SYSTEMS OF EQUATIONS
- Page 940 and 941:
922 CHAPTER 11 SYSTEMS OF EQUATIONS
- Page 942 and 943:
924 CHAPTER 11 SYSTEMS OF EQUATIONS
- Page 944 and 945:
926 CHAPTER 11 SYSTEMS OF EQUATIONS
- Page 946 and 947:
928 CHAPTER 11 SYSTEMS OF EQUATIONS
- Page 948 and 949:
930 CHAPTER 11 SYSTEMS OF EQUATIONS
- Page 950 and 951:
932 CHAPTER 11 SYSTEMS OF EQUATIONS
- Page 952 and 953:
934 CHAPTER 11 SYSTEMS OF EQUATIONS
- Page 954 and 955:
936 CHAPTER 11 SYSTEMS OF EQUATIONS
- Page 956 and 957:
938 CHAPTER 11 SYSTEMS OF EQUATIONS
- Page 958 and 959:
940 CHAPTER 11 SYSTEMS OF EQUATIONS
- Page 960 and 961:
942 CHAPTER 11 SYSTEMS OF EQUATIONS
- Page 962 and 963:
944 CHAPTER 11 SYSTEMS OF EQUATIONS
- Page 964 and 965:
946 CHAPTER 11 SYSTEMS OF EQUATIONS
- Page 966 and 967:
948 CHAPTER 11 SYSTEMS OF EQUATIONS
- Page 968 and 969:
950 CHAPTER 11 SYSTEMS OF EQUATIONS
- Page 970 and 971:
952 CHAPTER 11 SYSTEMS OF EQUATIONS
- Page 972 and 973:
954 CHAPTER 11 SYSTEMS OF EQUATIONS
- Page 974 and 975:
956 CHAPTER 11 SYSTEMS OF EQUATIONS
- Page 976 and 977:
958 CHAPTER 11 SYSTEMS OF EQUATIONS
- Page 978 and 979:
960 CHAPTER 11 SYSTEMS OF EQUATIONS
- Page 980 and 981:
962 CHAPTER 11 SYSTEMS OF EQUATIONS
- Page 982 and 983:
964 CHAPTER 11 SYSTEMS OF EQUATIONS
- Page 984 and 985:
966 CHAPTER 11 SYSTEMS OF EQUATIONS
- Page 986 and 987:
968 CHAPTER 11 SYSTEMS OF EQUATIONS
- Page 988 and 989:
970 CHAPTER 11 SYSTEMS OF EQUATIONS
- Page 990 and 991:
972 CHAPTER 11 SYSTEMS OF EQUATIONS
- Page 992 and 993:
974 CHAPTER 11 SYSTEMS OF EQUATIONS
- Page 994 and 995:
976 CHAPTER 11 SYSTEMS OF EQUATIONS
- Page 996 and 997:
978 CHAPTER 11 SYSTEMS OF EQUATIONS
- Page 998 and 999:
980 CHAPTER 11 SYSTEMS OF EQUATIONS
- Page 1000 and 1001:
982 CHAPTER 12 ANALYTIC GEOMETRY LE
- Page 1002 and 1003:
984 CHAPTER 12 ANALYTIC GEOMETRY De
- Page 1004 and 1005:
986 CHAPTER 12 ANALYTIC GEOMETRY Ho
- Page 1006 and 1007:
988 CHAPTER 12 ANALYTIC GEOMETRY 2.
- Page 1008 and 1009:
990 CHAPTER 12 ANALYTIC GEOMETRY Tr
- Page 1010 and 1011:
992 CHAPTER 12 ANALYTIC GEOMETRY Tr
- Page 1012 and 1013:
994 CHAPTER 12 ANALYTIC GEOMETRY So
- Page 1014 and 1015:
996 CHAPTER 12 ANALYTIC GEOMETRY 48
- Page 1016 and 1017:
998 CHAPTER 12 ANALYTIC GEOMETRY No
- Page 1018 and 1019:
1000 CHAPTER 12 ANALYTIC GEOMETRY S
- Page 1020 and 1021:
1002 CHAPTER 12 ANALYTIC GEOMETRY E
- Page 1022 and 1023:
1004 CHAPTER 12 ANALYTIC GEOMETRY 3
- Page 1024 and 1025:
1006 CHAPTER 12 ANALYTIC GEOMETRY y
- Page 1026 and 1027:
1008 CHAPTER 12 ANALYTIC GEOMETRY y
- Page 1028 and 1029:
1010 CHAPTER 12 ANALYTIC GEOMETRY T
- Page 1030 and 1031:
1012 CHAPTER 12 ANALYTIC GEOMETRY 3
- Page 1032 and 1033:
1014 CHAPTER 12 ANALYTIC GEOMETRY L
- Page 1034 and 1035:
1016 CHAPTER 12 ANALYTIC GEOMETRY s
- Page 1036 and 1037:
1018 CHAPTER 12 ANALYTIC GEOMETRY T
- Page 1038 and 1039:
1020 CHAPTER 12 ANALYTIC GEOMETRY H
- Page 1040 and 1041:
1022 CHAPTER 12 ANALYTIC GEOMETRY P
- Page 1042 and 1043:
1024 CHAPTER 12 ANALYTIC GEOMETRY 1
- Page 1044 and 1045:
1026 CHAPTER 12 ANALYTIC GEOMETRY E
- Page 1046 and 1047:
1028 CHAPTER 12 ANALYTIC GEOMETRY I
- Page 1048 and 1049:
1030 CHAPTER 12 ANALYTIC GEOMETRY c
- Page 1050 and 1051:
1032 CHAPTER 12 ANALYTIC GEOMETRY B
- Page 1052 and 1053:
1034 CHAPTER 12 ANALYTIC GEOMETRY N
- Page 1054 and 1055:
1036 CHAPTER 12 ANALYTIC GEOMETRY a
- Page 1056 and 1057:
1038 CHAPTER 12 ANALYTIC GEOMETRY 1
- Page 1058 and 1059:
1040 CHAPTER 12 ANALYTIC GEOMETRY L
- Page 1060 and 1061:
1042 CHAPTER 12 ANALYTIC GEOMETRY B
- Page 1062 and 1063:
1044 CHAPTER 12 ANALYTIC GEOMETRY A
- Page 1064 and 1065:
1046 CHAPTER 12 ANALYTIC GEOMETRY A
- Page 1066 and 1067:
1048 CHAPTER 12 ANALYTIC GEOMETRY 1
- Page 1068 and 1069:
1050 CHAPTER 12 ANALYTIC GEOMETRY H
- Page 1070 and 1071:
1052 CHAPTER 12 ANALYTIC GEOMETRY C
- Page 1072 and 1073:
1054 CHAPTER 12 ANALYTIC GEOMETRY C
- Page 1074 and 1075:
1056 CHAPTER 13 SEQUENCES, PROBABIL
- Page 1076 and 1077:
1058 CHAPTER 13 SEQUENCES, PROBABIL
- Page 1078 and 1079:
1060 CHAPTER 13 SEQUENCES, PROBABIL
- Page 1080 and 1081:
1062 CHAPTER 13 SEQUENCES, PROBABIL
- Page 1082 and 1083:
1064 CHAPTER 13 SEQUENCES, PROBABIL
- Page 1084 and 1085:
1066 CHAPTER 13 SEQUENCES, PROBABIL
- Page 1086 and 1087:
1068 CHAPTER 13 SEQUENCES, PROBABIL
- Page 1088 and 1089:
1070 CHAPTER 13 SEQUENCES, PROBABIL
- Page 1090 and 1091:
1072 CHAPTER 13 SEQUENCES, PROBABIL
- Page 1092 and 1093:
1074 CHAPTER 13 SEQUENCES, PROBABIL
- Page 1094 and 1095:
1076 CHAPTER 13 SEQUENCES, PROBABIL
- Page 1096 and 1097:
1078 CHAPTER 13 SEQUENCES, PROBABIL
- Page 1098 and 1099:
1080 CHAPTER 13 SEQUENCES, PROBABIL
- Page 1100 and 1101:
1082 CHAPTER 13 SEQUENCES, PROBABIL
- Page 1102 and 1103:
1084 CHAPTER 13 SEQUENCES, PROBABIL
- Page 1104 and 1105:
1086 CHAPTER 13 SEQUENCES, PROBABIL
- Page 1106 and 1107:
1088 CHAPTER 13 SEQUENCES, PROBABIL
- Page 1108 and 1109:
1090 CHAPTER 13 SEQUENCES, PROBABIL
- Page 1110 and 1111:
1092 CHAPTER 13 SEQUENCES, PROBABIL
- Page 1112 and 1113:
1094 CHAPTER 13 SEQUENCES, PROBABIL
- Page 1114 and 1115:
1096 CHAPTER 13 SEQUENCES, PROBABIL
- Page 1116 and 1117:
1098 CHAPTER 13 SEQUENCES, PROBABIL
- Page 1118 and 1119:
1100 CHAPTER 13 SEQUENCES, PROBABIL
- Page 1120 and 1121:
1102 CHAPTER 13 SEQUENCES, PROBABIL
- Page 1122 and 1123:
1104 CHAPTER 13 SEQUENCES, PROBABIL
- Page 1124 and 1125:
1106 CHAPTER 13 SEQUENCES, PROBABIL
- Page 1126 and 1127:
1108 CHAPTER 13 SEQUENCES, PROBABIL
- Page 1128 and 1129:
1110 CHAPTER 13 SEQUENCES, PROBABIL
- Page 1130 and 1131:
1112 CHAPTER 13 SEQUENCES, PROBABIL
- Page 1132 and 1133:
1114 CHAPTER 13 SEQUENCES, PROBABIL
- Page 1134 and 1135:
1116 CHAPTER 13 SEQUENCES, PROBABIL
- Page 1136 and 1137:
1118 CHAPTER 13 SEQUENCES, PROBABIL
- Page 1138 and 1139:
1120 CHAPTER 13 SEQUENCES, PROBABIL
- Page 1140 and 1141:
1122 CHAPTER 13 SEQUENCES, PROBABIL
- Page 1142 and 1143:
1124 CHAPTER 13 SEQUENCES, PROBABIL
- Page 1144 and 1145:
1126 CHAPTER 13 SEQUENCES, PROBABIL
- Page 1146 and 1147:
1128 CHAPTER 13 SEQUENCES, PROBABIL
- Page 1148 and 1149:
1130 CHAPTER 13 SEQUENCES, PROBABIL
- Page 1150 and 1151:
1132 CHAPTER 13 SEQUENCES, PROBABIL
- Page 1152 and 1153:
1134 CHAPTER 13 SEQUENCES, PROBABIL
- Page 1154 and 1155:
A-2 APPENDIX A2 Graphs of the Trigo
- Page 1156 and 1157:
A-4 APPENDIX Identities Half-Angle
- Page 1158 and 1159:
B-2 TRY IT ANSWERS Section 2.2 1. x
- Page 1160 and 1161:
B-4 TRY IT ANSWERS 3. The domain is
- Page 1162 and 1163:
B-6 TRY IT ANSWERS Section 6.5 1. l
- Page 1164 and 1165:
B-8 TRY IT ANSWERS 5. _______ cos
- Page 1166 and 1167:
B-10 TRY IT ANSWERS Chapter 12 Sect
- Page 1169 and 1170:
Odd Answers CHAPTER 1 Section 1.1 1
- Page 1171 and 1172:
ODD ANSWERS C-3 41. m = − _ 9 43.
- Page 1173 and 1174:
ODD ANSWERS C-5 Chapter 2 Practice
- Page 1175 and 1176:
ODD ANSWERS C-7 41. Many solutions;
- Page 1177 and 1178:
ODD ANSWERS C-9 43. f −1 (x) = (1
- Page 1179 and 1180:
ODD ANSWERS C-11 39. Hawaii 41. Dur
- Page 1181 and 1182:
ODD ANSWERS C-13 13. 2x 2 − 3x +
- Page 1183 and 1184:
ODD ANSWERS C-15 67. Vertical asymp
- Page 1185 and 1186:
ODD ANSWERS C-17 57. APY = A(t) −
- Page 1187 and 1188:
ODD ANSWERS C-19 55. x = −5 y 5 4
- Page 1189 and 1190:
ODD ANSWERS C-21 ln(b + 1) − ln(b
- Page 1191 and 1192:
Section 7.4 1. Yes, when the refere
- Page 1193 and 1194:
ODD ANSWERS C-25 27. Stretching fac
- Page 1195 and 1196:
ODD ANSWERS C-27 17. Amplitude: non
- Page 1197 and 1198:
ODD ANSWERS C-29 49. 51. cos(a + b)
- Page 1199 and 1200:
ODD ANSWERS C-31 27. tan 3 x−tan
- Page 1201 and 1202:
ODD ANSWERS C-33 33. Lemniscate 35.
- Page 1203 and 1204:
ODD ANSWERS C-35 35. −3 −2 −1
- Page 1205 and 1206:
ODD ANSWERS C-37 Chapter 11 Section
- Page 1207 and 1208:
ODD ANSWERS C-39 59. B n = { Sectio
- Page 1209 and 1210:
ODD ANSWERS C-41 37. Center (−3,
- Page 1211 and 1212:
ODD ANSWERS C-43 39. −20 −15
- Page 1213 and 1214:
ODD ANSWERS C-45 Chapter 12 Practic
- Page 1215 and 1216:
ODD ANSWERS C-47 25. The series is
- Page 1217 and 1218:
Index A AAS (angle-angle-side) tria
- Page 1219 and 1220:
INDEX D-3 parametric form 840 paren