IFEATWORLD July 2022
A Members' Newsletter for the International Federation of Essential Oils & Aroma Trades.
A Members' Newsletter for the International Federation of Essential Oils & Aroma Trades.

Create successful ePaper yourself
Turn your PDF publications into a flip-book with our unique Google optimized e-Paper software.
160<br />
140<br />
120<br />
100<br />
42<br />
WORLD<br />
MY FAVOURITE • CHINESE CEDARWOOD OIL AND FIRWOOD OIL<br />
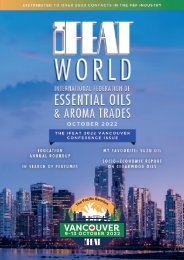
BIO-GRANULAR FUEL AND CHARCOAL MADE FROM OIL-EXTRACTED SAWDUST<br />
The fir roots used for oil processing<br />
today are mostly in Fujian, Jiangxi,<br />
Guangxi, Hunan, and Guizhou Provinces,<br />
where the old roots are still<br />
available and richer in the higher and<br />
deeper mountains. However, as time<br />
goes on, only the old roots in the<br />
higher mountains which are further<br />
away from the villages can be found.<br />
Previously, farmers would find and dig<br />
the tree roots in the mountains close<br />
to their villages but now no old roots<br />
can be found in the mountains near<br />
the villages. Trees were cut down in<br />
the 1960s and 1970s when it was in<br />
a planned economy era when all the<br />
forests were state-owned forest farms<br />
and the trees were heavily felled for<br />
economic construction. After decades<br />
of exposure, the felled roots rotted on<br />
the outside, leaving behind the centre<br />
of the roots, whose oil-rich core yields<br />
were around 4.2%. All of the roots<br />
are dug out mainly by hand, and this<br />
needs heavy labour, but in Qimen<br />
County of Anhui Province people<br />
now use an excavator to dig the tree<br />
roots for processing the oil, which has<br />
greatly reduced labour costs. However,<br />
the roots whose trunks were newly<br />
cut have a comparatively lower oil<br />
yield of about 2.3%.<br />
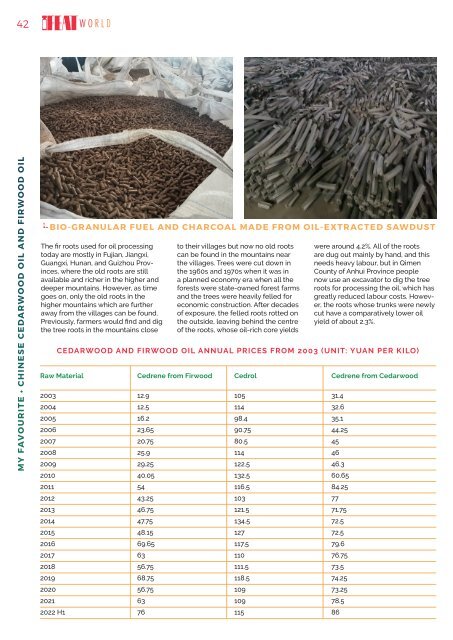
CEDARWOOD AND FIRWOOD OIL ANNUAL PRICES FROM 2003 (UNIT: YUAN PER KILO))<br />
Raw Material Cedrene from Firwood Cedrol Cedrene from Cedarwood<br />
2003 12.9 105 31.4<br />
2004 12.5 114 32.6<br />
2005 16.2 98.4 35.1<br />
2006 23.65 90.75 44.25<br />
2007 20.75 80.5 45<br />
2008 25.9 114 46<br />
2009 29.25 122.5 46.3<br />
2010 40.05 132.5 60.65<br />
2011 54 116.5 84.25<br />
2012 43.25 103 77<br />
2013 46.75 121.5 71.75<br />
2014 47.75 134.5 72.5<br />
2015 48.15 127 72.5<br />
2016 69.65 117.5 79.6<br />
2017 63 110 76.75<br />
2018 56.75 111.5 73.5<br />
2019 68.75 118.5 74.25<br />
2020 56.75 109 73.25<br />
2021 63 109 78.5<br />
<strong>2022</strong> H1 76 115 86<br />
80<br />
60<br />
40<br />
20<br />
0