

Molecular barcodes for soil nematode identification - Bolinfonet.org
Molecular barcodes for soil nematode identification - Bolinfonet.org
Molecular barcodes for soil nematode identification - Bolinfonet.org

Create successful ePaper yourself
Turn your PDF publications into a flip-book with our unique Google optimized e-Paper software.
848 R. FLOYD ET AL.<br />
MOTU to genus or family level in taxonomic classifications.<br />
Such attributions can be made <strong>for</strong> all our MOTU. The attributions<br />
can aid in morphological <strong>identification</strong> of cultured<br />
specimens, by indicating which part of the diversity of<br />
<strong>nematode</strong>s they derive from. These allocations can also<br />
be employed to use the MOTU <strong>for</strong> ecological analyses,<br />
as biological features such as feeding mode and reproductive<br />
capacity can be inferred by comparison with known<br />
taxa. MOTU surveys can thus be used in overall diversity,<br />
ecological and other indices as would morphologically<br />
defined specimens.<br />
Using ‘<strong>nematode</strong>-universal’ amplification primers, we<br />
were able to obtain PCR fragments and sequence from<br />
<strong>nematode</strong>s that map across the wide range of diversity in<br />
the Phylum Nematoda. Barcode sequences were obtained<br />
<strong>for</strong> taxa in Clades I, II, IV and V as defined by molecular<br />
phylogenetic analysis (note that clade III is exclusively<br />
animal-parasitic) (Blaxter et al. 1998). The method thus<br />
appears applicable to all <strong>nematode</strong>s, and not restricted to a<br />
specific phylogenetic group. There was no apparent correlation<br />
between stage and size of <strong>nematode</strong> and the success<br />
of the technique. We thus believe that we are not systematically<br />
missing aspects of the diversity. Our current MOTU<br />
diversity from the random survey at Sourhope is 23 taxa.<br />
This value is derived from only 240 sequences. We cannot<br />
yet robustly estimate the total number of taxa to be defined<br />
by MOTU at Sourhope, but the result of resampling a single<br />
subplot independently, as illustrated in Fig. 3, suggests<br />
that we are currently some way from saturating our<br />
sampling of the site: the ‘collector’s curve’ is still on the rise.<br />
Intensive sampling of grassland ecosystems has been<br />
carried out at Kansas (USA), Porton Down (UK) and several<br />
sites in Eastern Europe (Austria, Poland, Romania, Slovakia).<br />
The highest number of (morphologically identified) species<br />
is in Kansas, where 228 taxa are recorded (Orr & Dickerson<br />
1966; Boag & Yeates 1998). In the UK, the maximum number<br />
recorded is at Porton Down, where a chalk grassland<br />
yielded 154 taxa (Hodda & Wanless 1994). Overall, Boag<br />
and Yeates calculated the mean published species diversity<br />
in grasslands to be 42.8 taxa (with a range from 6 to 228)<br />
(Boag & Yeates 1998). In terms of upland grass ecosystems<br />
dominated by Festuca species, 18–27 species have been<br />
recorded in single survey samples (Yeates 1974). We have<br />
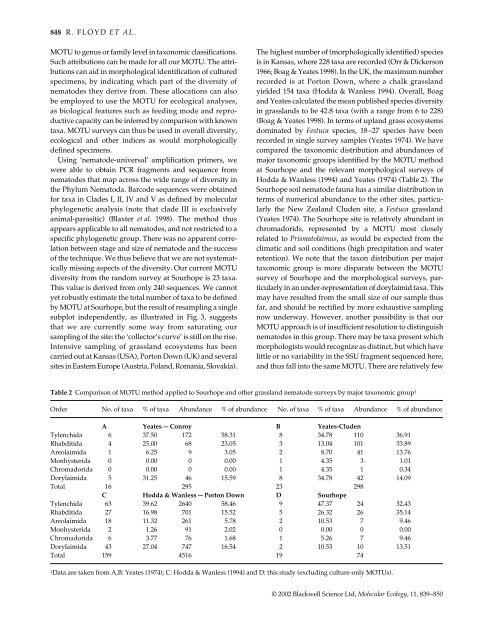
compared the taxonomic distribution and abundances of<br />
major taxonomic groups identified by the MOTU method<br />
at Sourhope and the relevant morphological surveys of<br />
Hodda & Wanless (1994) and Yeates (1974) (Table 2). The<br />
Sourhope <strong>soil</strong> <strong>nematode</strong> fauna has a similar distribution in<br />
terms of numerical abundance to the other sites, particularly<br />
the New Zealand Cluden site, a Festuca grassland<br />
(Yeates 1974). The Sourhope site is relatively abundant in<br />
chromadorids, represented by a MOTU most closely<br />
related to Prismatolaimus, as would be expected from the<br />
climatic and <strong>soil</strong> conditions (high precipitation and water<br />
retention). We note that the taxon distribution per major<br />
taxonomic group is more disparate between the MOTU<br />
survey of Sourhope and the morphological surveys, particularly<br />
in an under-representation of dorylaimid taxa. This<br />
may have resulted from the small size of our sample thus<br />
far, and should be rectified by more exhaustive sampling<br />
now underway. However, another possibility is that our<br />
MOTU approach is of insufficient resolution to distinguish<br />
<strong>nematode</strong>s in this group. There may be taxa present which<br />
morphologists would recognize as distinct, but which have<br />
little or no variability in the SSU fragment sequenced here,<br />
and thus fall into the same MOTU. There are relatively few<br />
Table 2 Comparison of MOTU method applied to Sourhope and other grassland <strong>nematode</strong> surveys by major taxonomic group 1<br />
Order No. of taxa % of taxa Abundance % of abundance No. of taxa % of taxa Abundance % of abundance<br />
A Yeates — Conroy B Yeates-Cluden<br />
Tylenchida 6 37.50 172 58.31 8 34.78 110 36.91<br />
Rhabditida 4 25.00 68 23.05 3 13.04 101 33.89<br />
Areolaimida 1 6.25 9 3.05 2 8.70 41 13.76<br />
Monhysterida 0 0.00 0 0.00 1 4.35 3 1.01<br />
Chromadorida 0 0.00 0 0.00 1 4.35 1 0.34<br />
Dorylaimida 5 31.25 46 15.59 8 34.78 42 14.09<br />
Total 16 295 23 298<br />
C Hodda & Wanless — Porton Down D Sourhope<br />
Tylenchida 63 39.62 2640 58.46 9 47.37 24 32.43<br />
Rhabditida 27 16.98 701 15.52 5 26.32 26 35.14<br />
Areolaimida 18 11.32 261 5.78 2 10.53 7 9.46<br />
Monhysterida 2 1.26 91 2.02 0 0.00 0 0.00<br />
Chromadorida 6 3.77 76 1.68 1 5.26 7 9.46<br />
Dorylaimida 43 27.04 747 16.54 2 10.53 10 13.51<br />
Total 159 4516 19 74<br />
1Data are taken from A,B: Yeates (1974); C: Hodda & Wanless (1994) and D: this study (excluding culture-only MOTUs).<br />
© 2002 Blackwell Science Ltd, <strong>Molecular</strong> Ecology, 11, 839–850
