Bunker Hill Master Plan Revision - Copy.pdf - Bunker Hill Township
Bunker Hill Master Plan Revision - Copy.pdf - Bunker Hill Township
Bunker Hill Master Plan Revision - Copy.pdf - Bunker Hill Township

You also want an ePaper? Increase the reach of your titles
YUMPU automatically turns print PDFs into web optimized ePapers that Google loves.
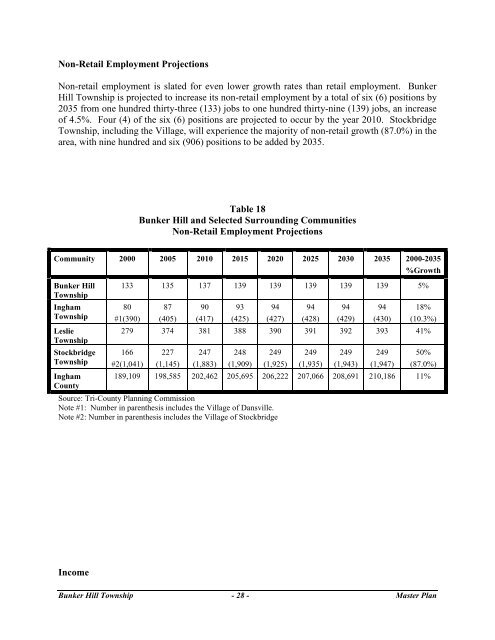
Non-Retail Employment Projections<br />
Non-retail employment is slated for even lower growth rates than retail employment. <strong>Bunker</strong><br />
<strong>Hill</strong> <strong>Township</strong> is projected to increase its non-retail employment by a total of six (6) positions by<br />
2035 from one hundred thirty-three (133) jobs to one hundred thirty-nine (139) jobs, an increase<br />
of 4.5%. Four (4) of the six (6) positions are projected to occur by the year 2010. Stockbridge<br />
<strong>Township</strong>, including the Village, will experience the majority of non-retail growth (87.0%) in the<br />
area, with nine hundred and six (906) positions to be added by 2035.<br />
Table 18<br />
<strong>Bunker</strong> <strong>Hill</strong> and Selected Surrounding Communities<br />
Non-Retail Employment Projections<br />
Community 2000 2005 2010 2015 2020 2025 2030 2035 2000-2035<br />
<strong>Bunker</strong> <strong>Hill</strong><br />
<strong>Township</strong><br />
Ingham<br />
<strong>Township</strong><br />
Leslie<br />
<strong>Township</strong><br />
Stockbridge<br />
<strong>Township</strong><br />
Ingham<br />
County<br />
%Growth<br />
133 135 137 139 139 139 139 139 5%<br />
80<br />
#1(390)<br />
87<br />
(405)<br />
90<br />
(417)<br />
93<br />
(425)<br />
<strong>Bunker</strong> <strong>Hill</strong> <strong>Township</strong> - 28 - <strong>Master</strong> <strong>Plan</strong><br />
94<br />
(427)<br />
94<br />
(428)<br />
94<br />
(429)<br />
94<br />
(430)<br />
18%<br />
(10.3%)<br />
279 374 381 388 390 391 392 393 41%<br />
166<br />
#2(1,041)<br />
227<br />
(1,145)<br />
247<br />
(1,883)<br />
248<br />
(1,909)<br />
249<br />
(1,925)<br />
249<br />
(1,935)<br />
249<br />
(1,943)<br />
249<br />
(1,947)<br />
50%<br />
(87.0%)<br />
189,109 198,585 202,462 205,695 206,222 207,066 208,691 210,186 11%<br />
Source: Tri-County <strong>Plan</strong>ning Commission<br />
Note #1: Number in parenthesis includes the Village of Dansville.<br />
Note #2: Number in parenthesis includes the Village of Stockbridge<br />
Income