LeCroy WaveRunner 6 Zi Datasheet - Ndn
LeCroy WaveRunner 6 Zi Datasheet - Ndn
LeCroy WaveRunner 6 Zi Datasheet - Ndn
You also want an ePaper? Increase the reach of your titles
YUMPU automatically turns print PDFs into web optimized ePapers that Google loves.
18<br />
HEADLINE<br />
specifications<br />
SpECiFiCATionS<br />
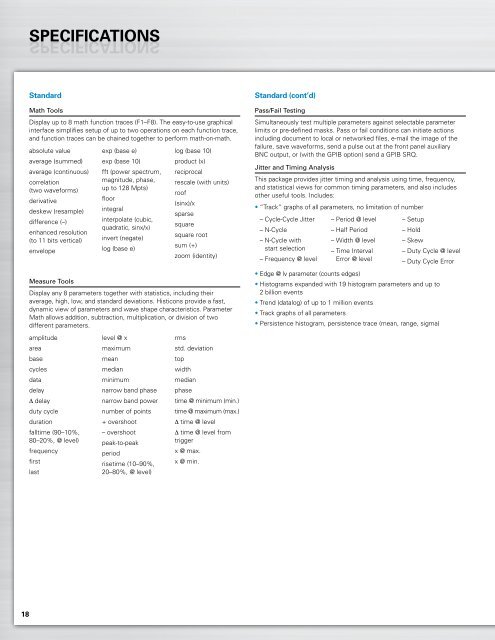
Standard<br />
Math Tools<br />
Display up to 8 math function traces (F1–F8). The easy-to-use graphical<br />
interface simplifies setup of up to two operations on each function trace,<br />
and function traces can be chained together to perform math-on-math.<br />
absolute value exp (base e)<br />
log (base 10)<br />
average (summed) exp (base 10)<br />
product (x)<br />
average (continuous) fft (power spectrum, reciprocal<br />
correlation<br />
(two waveforms)<br />
derivative<br />
deskew (resample)<br />
difference (–)<br />
enhanced resolution<br />
(to 11 bits vertical)<br />
envelope<br />
magnitude, phase,<br />
up to 128 Mpts)<br />
floor<br />
integral<br />
interpolate (cubic,<br />
quadratic, sinx/x)<br />
invert (negate)<br />
log (base e)<br />
rescale (with units)<br />
roof<br />
(sinx)/x<br />
sparse<br />
square<br />
square root<br />
sum (+)<br />
zoom (identity)<br />
Measure Tools<br />
Display any 8 parameters together with statistics, including their<br />
average, high, low, and standard deviations. Histicons provide a fast,<br />
dynamic view of parameters and wave shape characteristics. Parameter<br />
Math allows addition, subtraction, multiplication, or division of two<br />
different parameters.<br />
amplitude<br />
level @ x<br />
rms<br />
area<br />
maximum<br />
std. deviation<br />
base<br />
mean<br />
top<br />
cycles<br />
median<br />
width<br />
data<br />
minimum<br />
median<br />
delay<br />
narrow band phase phase<br />
∆ delay<br />
narrow band power time @ minimum (min.)<br />
duty cycle<br />
number of points time @ maximum (max.)<br />
duration<br />
+ overshoot<br />
∆ time @ level<br />
falltime (90–10%, – overshoot<br />
∆ time @ level from<br />
80–20%, @ level) peak-to-peak<br />
trigger<br />
frequency<br />
period<br />
x @ max.<br />
first<br />
risetime (10–90%, x @ min.<br />
last<br />
20–80%, @ level)<br />
Standard (cont’d)<br />
Pass/Fail Testing<br />
Simultaneously test multiple parameters against selectable parameter<br />
limits or pre-defined masks. Pass or fail conditions can initiate actions<br />
including document to local or networked files, e-mail the image of the<br />
failure, save waveforms, send a pulse out at the front panel auxiliary<br />
BNC output, or (with the GPIB option) send a GPIB SRQ.<br />
Jitter and Timing Analysis<br />
This package provides jitter timing and analysis using time, frequency,<br />
and statistical views for common timing parameters, and also includes<br />
other useful tools. Includes:<br />
• “Track” graphs of all parameters, no limitation of number<br />
– Cycle-Cycle Jitter – Period @ level – Setup<br />
– N-Cycle<br />
– Half Period<br />
– Hold<br />
– N-Cycle with – Width @ level – Skew<br />
start selection – Time Interval – Duty Cycle @ level<br />
– Frequency @ level Error @ level – Duty Cycle Error<br />
• Edge @ lv parameter (counts edges)<br />
• Histograms expanded with 19 histogram parameters and up to<br />
2 billion events<br />
• Trend (datalog) of up to 1 million events<br />
• Track graphs of all parameters<br />
• Persistence histogram, persistence trace (mean, range, sigma)


