The Economic Value of Citizenship for Immigrants in the United States
The Economic Value of Citizenship for Immigrants in the United States
The Economic Value of Citizenship for Immigrants in the United States

You also want an ePaper? Increase the reach of your titles
YUMPU automatically turns print PDFs into web optimized ePapers that Google loves.
MIgrATIoN PolICY INSTITUTe<br />
iii. What is <strong>the</strong> economic <strong>Value</strong> <strong>of</strong> naturalization?<br />
Given that citizenship both signals <strong>the</strong> <strong>in</strong>tegration already achieved and opens up opportunities <strong>for</strong><br />
fur<strong>the</strong>r <strong>in</strong>tegration, it is perhaps no surprise that naturalized immigrants fare better <strong>in</strong> <strong>the</strong> labor market<br />
than noncitizens. On <strong>the</strong> one hand, naturalized immigrants have characteristics associated with economic<br />
success, such as higher levels <strong>of</strong> education and English language ability, and longer tenure <strong>in</strong> <strong>the</strong> US labor<br />
market — characteristics that are <strong>in</strong> part responsible <strong>for</strong> <strong>the</strong>ir ability to obta<strong>in</strong> citizenship. On <strong>the</strong> o<strong>the</strong>r<br />
hand, naturalization can br<strong>in</strong>g direct benefits such as access to a wider range <strong>of</strong> jobs and <strong>the</strong> ability to<br />
signal social and cultural <strong>in</strong>tegration to prospective employers.<br />
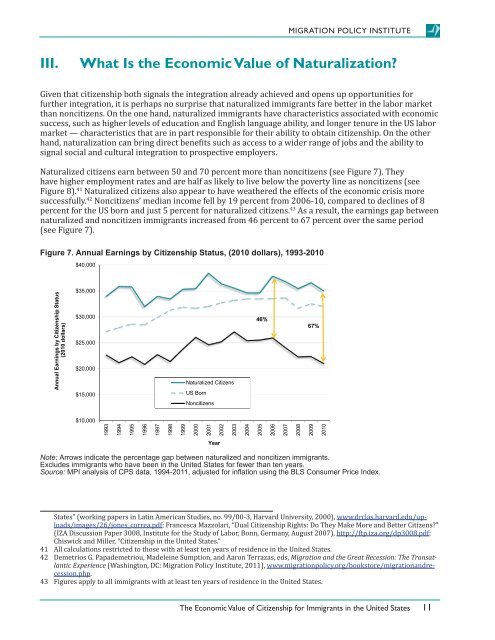
Naturalized citizens earn between 50 and 70 percent more than noncitizens (see Figure 7). <strong>The</strong>y<br />
have higher employment rates and are half as likely to live below <strong>the</strong> poverty l<strong>in</strong>e as noncitizens (see<br />
Figure 8). 41 Naturalized citizens also appear to have wea<strong>the</strong>red <strong>the</strong> effects <strong>of</strong> <strong>the</strong> economic crisis more<br />
successfully. 42 Noncitizens’ median <strong>in</strong>come fell by 19 percent from 2006-10, compared to decl<strong>in</strong>es <strong>of</strong> 8<br />
percent <strong>for</strong> <strong>the</strong> US born and just 5 percent <strong>for</strong> naturalized citizens. 43 As a result, <strong>the</strong> earn<strong>in</strong>gs gap between<br />
naturalized and noncitizen immigrants <strong>in</strong>creased from 46 percent to 67 percent over <strong>the</strong> same period<br />
(see Figure 7).<br />
Figure 7. Annual Earn<strong>in</strong>gs by <strong>Citizenship</strong> Status, (2010 dollars), 1993-2010<br />
Annual Earn<strong>in</strong>gs by <strong>Citizenship</strong> Status<br />
(2010 dollars)<br />
$40,000<br />
$35,000<br />
$30,000<br />
$25,000<br />
$20,000<br />
$15,000<br />
$10,000<br />
1993<br />
1994<br />
1995<br />
1996<br />
1997<br />
1998<br />
1999<br />
naturalized citizens<br />
US Born<br />
noncitizens<br />
2000<br />
2001<br />
Year<br />
Note: arrows <strong>in</strong>dicate <strong>the</strong> percentage gap between naturalized and noncitizen immigrants.<br />
excludes immigrants who have been <strong>in</strong> <strong>the</strong> <strong>United</strong> <strong>States</strong> <strong>for</strong> fewer than ten years.<br />
Source: MPI analysis <strong>of</strong> CPS data, 1994-2011, adjusted <strong>for</strong> <strong>in</strong>flation us<strong>in</strong>g <strong>the</strong> BLS Consumer Price Index.<br />
2002<br />
2003<br />
<strong>States</strong>” (work<strong>in</strong>g papers <strong>in</strong> Lat<strong>in</strong> American Studies, no. 99/00-3, Harvard University, 2000), www.drclas.harvard.edu/uploads/images/26/jones_correa.pdf;<br />
Francesca Mazzolari, “Dual <strong>Citizenship</strong> Rights: Do <strong>The</strong>y Make More and Better Citizens?”<br />
(IZA Discussion Paper 3008, Institute <strong>for</strong> <strong>the</strong> Study <strong>of</strong> Labor, Bonn, Germany, August 2007), http://ftp.iza.org/dp3008.pdf;<br />
Chiswick and Miller, “<strong>Citizenship</strong> <strong>in</strong> <strong>the</strong> <strong>United</strong> <strong>States</strong>.”<br />
41 All calculations restricted to those with at least ten years <strong>of</strong> residence <strong>in</strong> <strong>the</strong> <strong>United</strong> <strong>States</strong>.<br />
42 Demetrios G. Papademetriou, Madele<strong>in</strong>e Sumption, and Aaron Terrazas, eds, Migration and <strong>the</strong> Great Recession: <strong>The</strong> Transatlantic<br />
Experience (Wash<strong>in</strong>gton, DC: Migration Policy Institute, 2011), www.migrationpolicy.org/bookstore/migrationandrecession.php.<br />
43 Figures apply to all immigrants with at least ten years <strong>of</strong> residence <strong>in</strong> <strong>the</strong> <strong>United</strong> <strong>States</strong>.<br />
2004<br />
46%<br />
2005<br />
2006<br />
2007<br />
2008<br />
<strong>The</strong> economic <strong>Value</strong> <strong>of</strong> <strong>Citizenship</strong> <strong>for</strong> <strong>Immigrants</strong> <strong>in</strong> <strong>the</strong> <strong>United</strong> <strong>States</strong><br />
67%<br />
2009<br />
2010<br />
11