Erroneous Concepts behind NATM
Erroneous Concepts behind NATM
Erroneous Concepts behind NATM

Create successful ePaper yourself
Turn your PDF publications into a flip-book with our unique Google optimized e-Paper software.
p i<br />
p i<br />
'R<br />
PLASTIC ZONE<br />
ASSUMED BY <strong>NATM</strong><br />
(NOT APPROVED)<br />
PLASTICITY THEORY<br />
'R<br />
V 1<br />
PEAK STRENGTH<br />
V<br />
1<br />
V<br />
RESIDUAL STRENGTH<br />
LOSS OF STRENGTH<br />
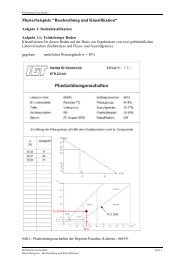
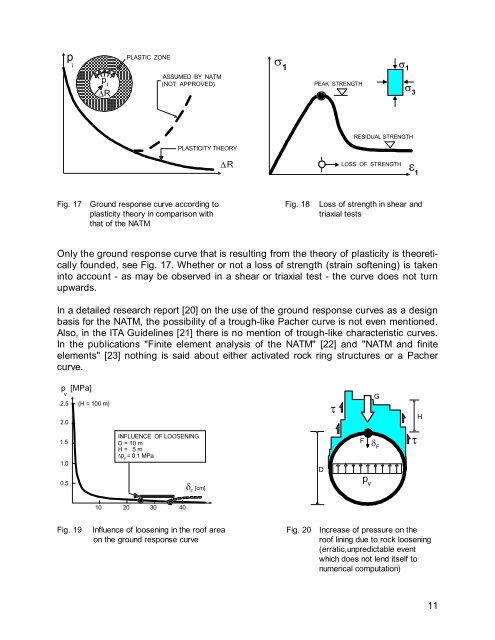
Fig. 17 Ground response curve according to Fig. 18 Loss of strength in shear and<br />
plasticity theory in comparison with triaxial tests<br />
that of the <strong>NATM</strong><br />
Only the ground response curve that is resulting from the theory of plasticity is theoretically<br />
founded, see Fig. 17. Whether or not a loss of strength (strain softening) is taken<br />
into account - as may be observed in a shear or triaxial test - the curve does not turn<br />
upwards.<br />
In a detailed research report [20] on the use of the ground response curves as a design<br />
basis for the <strong>NATM</strong>, the possibility of a trough-like Pacher curve is not even mentioned.<br />
Also, in the ITA Guidelines [21] there is no mention of trough-like characteristic curves.<br />
In the publications "Finite element analysis of the <strong>NATM</strong>" [22] and "<strong>NATM</strong> and finite<br />
elements" [23] nothing is said about either activated rock ring structures or a Pacher<br />
curve.<br />
p [MPa]<br />
v<br />
2.5 (H = 100 m)<br />
2.0<br />
1.5<br />
1.0<br />
0.5<br />
INFLUENCE OF LOOSENING<br />
D = 10 m<br />
H = 5 m<br />
p = 0.1 MPa<br />
' F<br />
10 20 30 40<br />
G [cm]<br />
F<br />
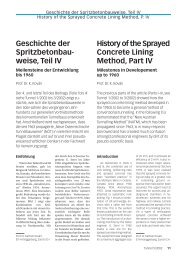
Fig. 19 Influence of loosening in the roof area Fig. 20 Increase of pressure on the<br />
on the ground response curve roof lining due to rock loosening<br />
(erratic,unpredictable event<br />
which does not lend itself to<br />
numerical computation)<br />
D<br />
W<br />
F<br />
p v<br />
G<br />
G F<br />
3<br />
H 1<br />
W<br />
H<br />
11