

In This Report
In This Report
In This Report

You also want an ePaper? Increase the reach of your titles
YUMPU automatically turns print PDFs into web optimized ePapers that Google loves.
Schwab <strong>In</strong>ternational Small-Cap Equity ETFÏ<br />
The Schwab <strong>In</strong>ternational Small-Cap Equity ETF (the fund) seeks to track as closely as possible, before fees and expenses, the<br />
total return of the FTSE Developed Small Cap ex-US Liquid <strong>In</strong>dex (the index). The index is comprised of small-capitalization<br />
companies in developed countries outside the U.S., as defined by the index provider. The index defines the small-capitalization<br />
universe as approximately the bottom 10% of the eligible universe with a minimum free-float capitalization of $150 million. The<br />
fund invests in a representative sample of securities included in the index that collectively has a similar profile to the index. Due to<br />
the use of representative sampling, the fund may not hold all of the securities included in the index.<br />
During the 12-month period that ended August 31, 2012, the fund closely tracked the index. The fund’s market price return was<br />
-5.35% and its NAV return was -5.91% (for an explanation of the market price and NAV returns, please refer to footnote 2 on the<br />
following page). The index returned -6.14% during the same period. Because the return of the index does not include operational<br />
and transactional costs, the return of the fund tends to differ from that of the index.<br />
Market Highlights. Small-cap international stocks generated modestly negative overall returns in U.S. dollar terms, with country<br />
markets in the index generating mixed results. The euro zone’s sovereign debt crisis weighed on the performance of international<br />
stocks, as did lackluster overall growth in developed economies around the world. The decline of most major currencies from the<br />
British pound to Swiss franc versus the U.S. dollar also reduced international stock returns in U.S. dollar terms.<br />
Contributors and Detractors. U.K. stocks were some of the biggest contributors to the index’s return, and to the return of the<br />
fund. The large average weight of this market reflected part of the reason for this contribution, with shares of U.K. companies<br />
representing approximately 17% of the fund. Stocks of U.K. companies benefitted from being alternatives to the crisis-plagued euro<br />
zone. U.K. stocks returned approximately 13% for the fund in U.S. dollar terms, a return that would have been higher still for<br />
U.S. investors if not for the roughly 2% depreciation of the British pound versus the U.S. dollar. Aberdeen Asset Management was<br />
a key U.K. performer. Stock of this large money management firm returned nearly 42% for the fund.<br />
Singaporean stocks, which represented an average weight of nearly 2% of the fund, also positively contributed to performance.<br />
Stocks in Singapore returned approximately 4% for the fund in U.S. dollar terms, which included a roughly 3% decline in the<br />
value of Singapore’s dollar relative to the U.S. dollar. Like other countries in the region, Singapore faced its share of challenges,<br />
enduring economic contraction toward the latter part of the report period as manufacturing output slowed amid lackluster global<br />
demand. Shares of SATS Ltd. provided one example of this market’s performance. The ground-handling and in-flight catering<br />
company returned approximately 23% for the fund.<br />
Japanese stocks were some of the bigger detractors from the fund’s performance. Shares of Japanese companies represented an<br />
average weight of approximately 15%. With Japan continuing to grapple with deflation and uninspiring economic growth, stocks<br />
in the country returned approximately -6% in U.S. dollar terms, which included a 2% depreciation in the value of the yen relative<br />
to the U.S. dollar. Shares of capacitor manufacturer and marketer Nichicon Corp. provided one example of the performance of<br />
Japanese stocks, returning -47% for the fund.<br />
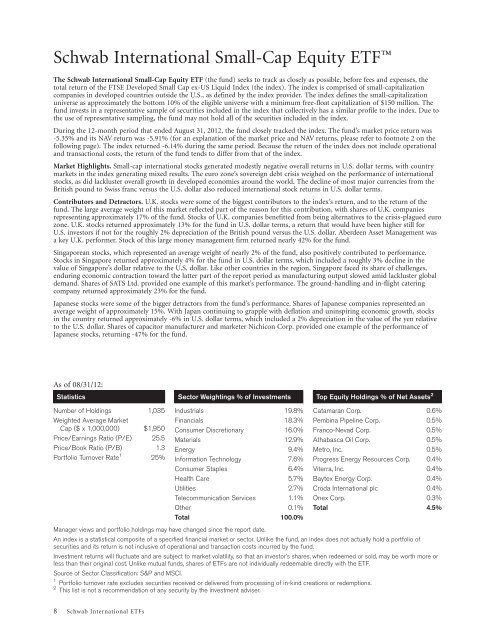
As of 08/31/12:<br />
Statistics<br />
Number of Holdings 1,035<br />
Weighted Average Market<br />
Cap ($ x 1,000,000) $1,950<br />
Price/Earnings Ratio (P/E) 25.5<br />
Price/Book Ratio (P/B) 1.3<br />
Portfolio Turnover Rate 1<br />
25%<br />
Sector Weightings % of <strong>In</strong>vestments<br />
<strong>In</strong>dustrials 19.8%<br />
Financials 18.3%<br />
Consumer Discretionary 16.0%<br />
Materials 12.9%<br />
Energy 9.4%<br />
<strong>In</strong>formation Technology 7.6%<br />
Consumer Staples 6.4%<br />
Health Care 5.7%<br />
Utilities 2.7%<br />
Telecommunication Services 1.1%<br />
Other 0.1%<br />
Total 100.0%<br />
Top Equity Holdings % of Net Assets 2<br />
Catamaran Corp. 0.6%<br />
Pembina Pipeline Corp. 0.5%<br />
Franco-Nevad Corp. 0.5%<br />
Athabasca Oil Corp. 0.5%<br />
Metro, <strong>In</strong>c. 0.5%<br />
Progress Energy Resources Corp. 0.4%<br />
Viterra, <strong>In</strong>c. 0.4%<br />
Baytex Energy Corp. 0.4%<br />
Croda <strong>In</strong>ternational plc 0.4%<br />
Onex Corp. 0.3%<br />
Total 4.5%<br />
Manager views and portfolio holdings may have changed since the report date.<br />
An index is a statistical composite of a specified financial market or sector. Unlike the fund, an index does not actually hold a portfolio of<br />
securities and its return is not inclusive of operational and transaction costs incurred by the fund.<br />
<strong>In</strong>vestment returns will fluctuate and are subject to market volatility, so that an investor’s shares, when redeemed or sold, may be worth more or<br />
less than their original cost. Unlike mutual funds, shares of ETFs are not individually redeemable directly with the ETF.<br />
Source of Sector Classification: S&P and MSCI.<br />
1<br />
Portfolio turnover rate excludes securities received or delivered from processing of in-kind creations or redemptions.<br />
2<br />
<strong>This</strong> list is not a recommendation of any security by the investment adviser.<br />
8 Schwab <strong>In</strong>ternational ETFs