THE CARIBSAVE CLIMATE CHANGE RISK ATLAS
THE CARIBSAVE CLIMATE CHANGE RISK ATLAS
THE CARIBSAVE CLIMATE CHANGE RISK ATLAS

You also want an ePaper? Increase the reach of your titles
YUMPU automatically turns print PDFs into web optimized ePapers that Google loves.
Observed<br />
Mean<br />
1970-99<br />
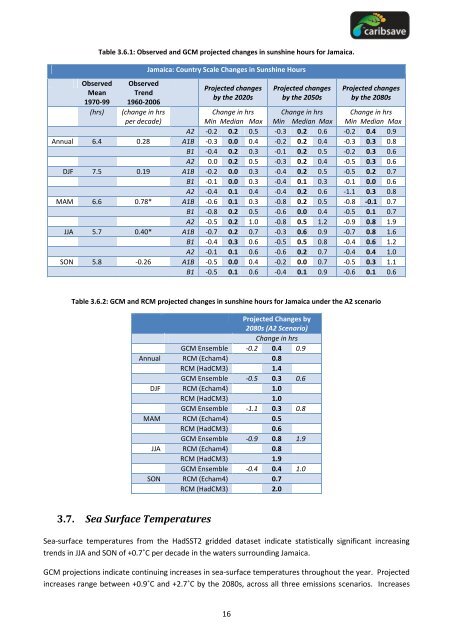
Table 3.6.1: Observed and GCM projected changes in sunshine hours for Jamaica.<br />
Observed<br />
Trend<br />
1960-2006<br />
Jamaica: Country Scale Changes in Sunshine Hours<br />
Projected changes<br />
by the 2020s<br />
16<br />
Projected changes<br />
by the 2050s<br />
Projected changes<br />
by the 2080s<br />
(hrs) (change in hrs<br />
Change in hrs Change in hrs Change in hrs<br />
per decade)<br />
Min Median Max Min Median Max Min Median Max<br />
A2 -0.2 0.2 0.5 -0.3 0.2 0.6 -0.2 0.4 0.9<br />
Annual 6.4 0.28 A1B -0.3 0.0 0.4 -0.2 0.2 0.4 -0.3 0.3 0.8<br />
B1 -0.4 0.2 0.3 -0.1 0.2 0.5 -0.2 0.3 0.6<br />
A2 0.0 0.2 0.5 -0.3 0.2 0.4 -0.5 0.3 0.6<br />
DJF 7.5 0.19 A1B -0.2 0.0 0.3 -0.4 0.2 0.5 -0.5 0.2 0.7<br />
B1 -0.1 0.0 0.3 -0.4 0.1 0.3 -0.1 0.0 0.6<br />
A2 -0.4 0.1 0.4 -0.4 0.2 0.6 -1.1 0.3 0.8<br />
MAM 6.6 0.78* A1B -0.6 0.1 0.3 -0.8 0.2 0.5 -0.8 -0.1 0.7<br />
B1 -0.8 0.2 0.5 -0.6 0.0 0.4 -0.5 0.1 0.7<br />
A2 -0.5 0.2 1.0 -0.8 0.5 1.2 -0.9 0.8 1.9<br />
JJA 5.7 0.40* A1B -0.7 0.2 0.7 -0.3 0.6 0.9 -0.7 0.8 1.6<br />
B1 -0.4 0.3 0.6 -0.5 0.5 0.8 -0.4 0.6 1.2<br />
A2 -0.1 0.1 0.6 -0.6 0.2 0.7 -0.4 0.4 1.0<br />
SON 5.8 -0.26 A1B -0.5 0.0 0.4 -0.2 0.0 0.7 -0.5 0.3 1.1<br />
B1 -0.5 0.1 0.6 -0.4 0.1 0.9 -0.6 0.1 0.6<br />
Table 3.6.2: GCM and RCM projected changes in sunshine hours for Jamaica under the A2 scenario<br />
3.7. Sea Surface Temperatures<br />
Projected Changes by<br />
2080s (A2 Scenario)<br />
Change in hrs<br />
GCM Ensemble -0.2 0.4 0.9<br />
Annual RCM (Echam4) 0.8<br />
RCM (HadCM3) 1.4<br />
GCM Ensemble -0.5 0.3 0.6<br />
DJF RCM (Echam4) 1.0<br />
RCM (HadCM3) 1.0<br />
GCM Ensemble -1.1 0.3 0.8<br />
MAM RCM (Echam4) 0.5<br />
RCM (HadCM3) 0.6<br />
GCM Ensemble -0.9 0.8 1.9<br />
JJA RCM (Echam4) 0.8<br />
RCM (HadCM3) 1.9<br />
GCM Ensemble -0.4 0.4 1.0<br />
SON RCM (Echam4) 0.7<br />
RCM (HadCM3) 2.0<br />
Sea-surface temperatures from the HadSST2 gridded dataset indicate statistically significant increasing<br />
trends in JJA and SON of +0.7˚C per decade in the waters surrounding Jamaica.<br />
GCM projections indicate continuing increases in sea-surface temperatures throughout the year. Projected<br />
increases range between +0.9˚C and +2.7˚C by the 2080s, across all three emissions scenarios. Increases