Emporio Investment Report Test

Create successful ePaper yourself
Turn your PDF publications into a flip-book with our unique Google optimized e-Paper software.
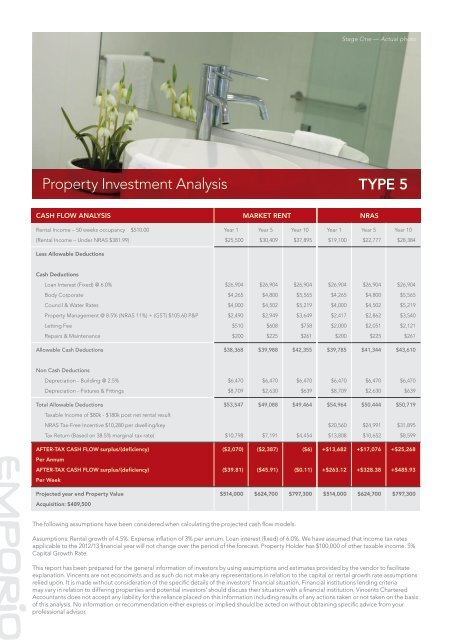
CASH FLOW ANALYSIS<br />
Rental Income – 50 weeks occupancy $510.00<br />
(Rental Income – Under NRAS $381.99)<br />
Less Allowable Deductions<br />
Cash Deductions<br />
Loan Interest (Fixed) @ 6.0%<br />
Body Corporate<br />
Council & Water Rates<br />
Property Management @ 8.5% (NRAS 11%) + (GST) $105.60 P&P<br />
Letting Fee<br />
Repairs & Maintenance<br />
Allowable Cash Deductions<br />
Non Cash Deductions<br />
Depreciation - Building @ 2.5%<br />
Depreciation - Fixtures & Fittings<br />
Total Allowable Deductions<br />
Taxable Income of $80k - $180k post net rental result<br />
NRAS Tax-Free Incentive $10,280 per dwelling/key<br />
Tax Return (Based on 38.5% marginal tax rate)<br />
AFTER-TAX CASH FLOW surplus/(deficiency)<br />
Per Annum<br />
AFTER-TAX CASH FLOW surplus/(deficiency)<br />
Per Week<br />
Projected year end Property Value<br />
Acquisition: $489,500<br />
Year 1<br />
$25,500<br />
$26,904<br />
$4,265<br />
$4,000<br />
$2,490<br />
$510<br />
$200<br />
$38,368<br />
$6,470<br />
$8,709<br />
$53,547<br />
$10,798<br />
($2,070)<br />
($39.81)<br />
Year 5<br />
$30,409<br />
$26,904<br />
$4,800<br />
$4,502<br />
$2,949<br />
$608<br />
$225<br />
$39,988<br />
$6,470<br />
$2,630<br />
$49,088<br />
$7,191<br />
($2,387)<br />
($45.91)<br />
The following assumptions have been considered when calculating the projected cash flow models.<br />
MARKET RENT NRAS<br />
Year 10<br />
$37,895<br />
$26,904<br />
$5,565<br />
$5,219<br />
$3,649<br />
$758<br />
$261<br />
$42,355<br />
$6,470<br />
$639<br />
$49,464<br />
$4,454<br />
($6)<br />
($0.11)<br />
Year 1<br />
$19,100<br />
$26,904<br />
$4,265<br />
$4,000<br />
$2,417<br />
$2,000<br />
$200<br />
$39,785<br />
$6,470<br />
$8,709<br />
$54,964<br />
$20,560<br />
$13,808<br />
+$13,682<br />
+$263.12<br />
Stage One — Actual photo<br />
Property <strong>Investment</strong> Analysis TYPE 5<br />
Year 5<br />
$22,777<br />
$26,904<br />
$4,800<br />
$4,502<br />
$2,862<br />
$2,051<br />
$225<br />
$41,344<br />
$6,470<br />
$2,630<br />
$50,444<br />
$24,991<br />
$10,652<br />
+$17,076<br />
+$328.38<br />
Year 10<br />
$28,384<br />
$26,904<br />
$5,565<br />
$5,219<br />
$3,540<br />
$2,121<br />
$261<br />
$43,610<br />
$6,470<br />
$639<br />
$50,719<br />
$31,895<br />
$8,599<br />
+$25,268<br />
+$485.93<br />
$514,000 $624,700 $797,300 $514,000 $624,700 $797,300<br />
Assumptions: Rental growth of 4.5%. Expense inflation of 3% per annum. Loan interest (fixed) of 6.0%. We have assumed that income tax rates<br />
applicable to the 2012/13 financial year will not change over the period of the forecast. Property Holder has $100,000 of other taxable income. 5%<br />
Capital Growth Rate.<br />
This report has been prepared for the general information of investors by using assumptions and estimates provided by the vendor to facilitate<br />
explanation. Vincents are not economists and as such do not make any representations in relation to the capital or rental growth rate assumptions<br />
relied upon. It is made without consideration of the specific details of the investors’ financial situation. Financial institutions lending criteria<br />
may vary in relation to differing properties and potential investors’ should discuss their situation with a financial institution. Vincents Chartered<br />
Accountants does not accept any liability for the reliance placed on this information including results of any actions taken or not taken on the basis<br />
of this analysis. No information or recommendation either express or implied should be acted on without obtaining specific advice from your<br />
professional advisor.