A Land Manager's Guide to Point Counts of Birds in the Southeast
A Land Manager's Guide to Point Counts of Birds in the Southeast
A Land Manager's Guide to Point Counts of Birds in the Southeast

You also want an ePaper? Increase the reach of your titles
YUMPU automatically turns print PDFs into web optimized ePapers that Google loves.
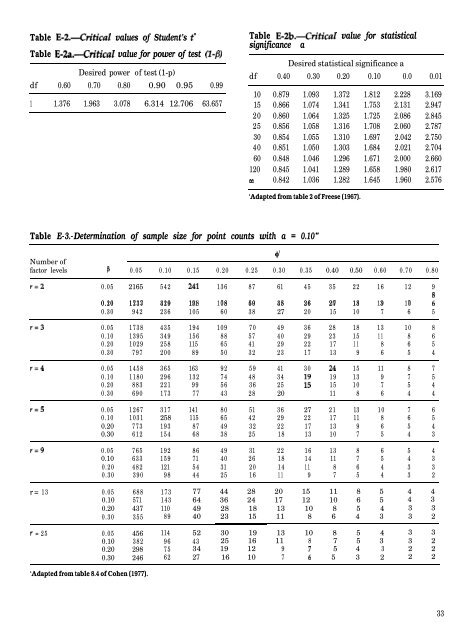
Table E-2.-Cdtical values <strong>of</strong> Student’s t*<br />
Table E-2a.-Critical value for power <strong>of</strong> test (I-/3)<br />
Desired power <strong>of</strong> test (1-p)<br />
df 0.60 0.70 0.80 0.90 0.95 0.99<br />
1 1.376 1.963 3.078 6.314 12.706 63.657<br />
Table E-2b.-Critical value for statistical<br />
significance a<br />
Desired statistical significance a<br />
df 0.40 0.30 0.20 0.10 0.0 0.01<br />
10 0.879 1.093 1.372 1.812 2.228 3.169<br />
15 0.866 1.074 1.341 1.753 2.131 2.947<br />
20 0.860 1.064 1.325 1.725 2.086 2.845<br />
25 0.856 1.058 1.316 1.708 2.060 2.787<br />
30 0.854 1.055 1.310 1.697 2.042 2.750<br />
40 0.851 1.050 1.303 1.684 2.021 2.704<br />
60 0.848 1.046 1.296 1.671 2.000 2.660<br />
120 0.845 1.041 1.289 1.658 1.980 2.617<br />
00 0.842 1.036 1.282 1.645 1.960 2.576<br />
‘Adapted from table 2 <strong>of</strong> Freese (1967).<br />
Table E-3.-Determ<strong>in</strong>ation <strong>of</strong> sample size for po<strong>in</strong>t counts with a = 0.10”<br />
Number <strong>of</strong><br />
fac<strong>to</strong>r levels<br />
B 0.05 0.10 0.15 0.20 0.25 0.30 0.35 0.40 0.50 0.60 0.70 0.80<br />
r=2 0.05 2165 542 241 136 87 61 45 35 22 16 12 9<br />
0.10 0.20 1713 1237 429 310 191 138 108 78 69 50 48 35 36 26 27 20 13 18 139 10 7 :<br />
0.30 942 236 105 60 38 27 20 15 10 7 6 5<br />
r=3 0.05 1738 435 194 109 70 49 36 28 18 13 10 8<br />
0.10 1395 349 156 88 57 40 29 23 15 11 8 6<br />
0.20 1029 258 115 65 41 29 22 17 11 8 6 5<br />
0.30 797 200 89 50 32 23 17 13 9 6 5 4<br />
r=4 0.05 1458 365 163 92 59 41 30 24 15 11 8 7<br />
0.10 1180 296 132 74 48 34 25 19 13 9 7 5<br />
0.20 883 221 99 56 36 25 i: 15 10 7 5 4<br />
0.30 690 173 77 43 28 20 11 8 6 4 4<br />
r=5 0.05 1267 317 141 80 51 36 27 21 13 10 7 6<br />
0.10 1031 258 115 65 42 29 22 17 11 8 6 5<br />
0.20 773 193 87 49 32 22 17 13 9 6 5 4<br />
0.30 612 154 68 38 25 18 13 10 7 5 4 3<br />
r=9 0.05 765 192 86 49 31 22 16 13 8 6 5 4<br />
0.10 633 159 71 40 26 18 14 11 7 5 4 3<br />
0.20 482 121 54 31 20 14 11 8 6 4 3 3<br />
0.30 390 98 44 25 16 11 9 7 5 4 3 2<br />
r= 13 0.05 688 173 77 44 28 20 15 11 8 5 4 4<br />
0.10 571 143 64 36 24 17 12 10 6 5 4 3<br />
0.20 437 110 49 28 18 13 10 8 5 4 3 3<br />
0.30 355 89 40 23 15 11 8 6 4 3 3 2<br />
T = 25 0.05 456 114 52 30 19 13 10 8 5 4 3 3<br />
0.10 382 96 43 25 16 11 8 7 5 3 3 2<br />
0.20 298 75 34 19 12 9 5 4 3 2 2<br />
0.30 246 62 27 16 10 7 2 5 3 2 2 2<br />
‘Adapted from table 8.4 <strong>of</strong> Cohen (1977).<br />
4’<br />
33