The Quarterly Transatlantic Tech Investment Review - Calibre One
The Quarterly Transatlantic Tech Investment Review - Calibre One
The Quarterly Transatlantic Tech Investment Review - Calibre One
You also want an ePaper? Increase the reach of your titles
YUMPU automatically turns print PDFs into web optimized ePapers that Google loves.
Welcome<br />
<strong>Investment</strong> Summary<br />
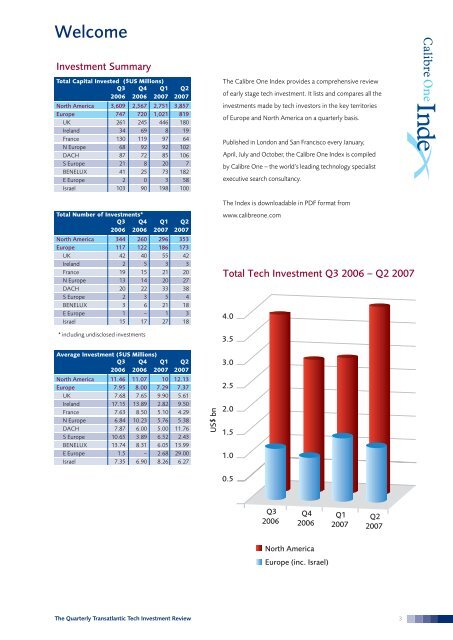
Total Capital Invested ($US Millions)<br />
Q3 Q4 Q1 Q2<br />
2006 2006 2007 2007<br />
North America 3,609 2,567 2,751 3,857<br />
Europe 747 720 1,021 819<br />
UK 261 245 446 180<br />
Ireland 34 69 8 19<br />
France 130 119 97 64<br />
N Europe 68 92 92 102<br />
DACH 87 72 85 106<br />
S Europe 21 8 20 7<br />
BENELUX 41 25 73 182<br />
E Europe 2 0 3 58<br />
Israel 103 90 198 100<br />
Total Number of <strong>Investment</strong>s*<br />
Q3 Q4 Q1 Q2<br />
2006 2006 2007 2007<br />
North America 344 260 296 353<br />
Europe 117 122 186 173<br />
UK 42 40 55 42<br />
Ireland 2 5 3 3<br />
France 19 15 21 20<br />
N Europe 13 14 20 27<br />
DACH 20 22 33 38<br />
S Europe 2 3 5 4<br />
BENELUX 3 6 21 18<br />
E Europe 1 – 1 3<br />
Israel 15 17 27 18<br />
* including undisclosed investments<br />
Average <strong>Investment</strong> ($US Millions)<br />
Q3 Q4 Q1 Q2<br />
2006 2006 2007 2007<br />
North America 11.46 11.07 10 12.13<br />
Europe 7.95 8.00 7.29 7.37<br />
UK 7.68 7.65 9.90 5.61<br />
Ireland 17.15 13.89 2.82 9.50<br />
France 7.63 8.50 5.10 4.29<br />
N Europe 6.84 10.23 5.76 5.38<br />
DACH 7.87 6.00 5.00 11.76<br />
S Europe 10.65 3.89 6.52 2.43<br />
BENELUX 13.74 8.31 6.05 13.99<br />
E Europe 1.5 – 2.68 29.00<br />
Israel 7.35 6.90 8.26 6.27<br />
<strong>The</strong> <strong>Quarterly</strong> <strong>Transatlantic</strong> <strong>Tech</strong> <strong>Investment</strong> <strong>Review</strong><br />
US$ bn<br />
<strong>The</strong> <strong>Calibre</strong> <strong>One</strong> Index provides a comprehensive review<br />
of early stage tech investment. It lists and compares all the<br />
investments made by tech investors in the key territories<br />
of Europe and North America on a quarterly basis.<br />
Published in London and San Francisco every January,<br />
April, July and October, the <strong>Calibre</strong> <strong>One</strong> Index is compiled<br />
by <strong>Calibre</strong> <strong>One</strong> – the world’s leading technology specialist<br />
executive search consultancy.<br />
<strong>The</strong> Index is downloadable in PDF format from<br />
www.calibreone.com<br />
Total <strong>Tech</strong> <strong>Investment</strong> Q3 2006 – Q2 2007<br />
4.0<br />
3.5<br />
3.0<br />
2.5<br />
2.0<br />
1.5<br />
1.0<br />
0.5<br />
Q3<br />
2006<br />
Q4<br />
2006<br />
North America<br />
Europe (inc. Israel)<br />
Q1<br />
2007<br />
Q2<br />
2007<br />
3


