VLSI RESEARCH INC
VLSI RESEARCH INC
VLSI RESEARCH INC

You also want an ePaper? Increase the reach of your titles
YUMPU automatically turns print PDFs into web optimized ePapers that Google loves.
support, field engineering support, spares support, support after sales, technical leadership in the<br />
supplier’s field, and the supplier’s overall commitment to supporting its customers’ needs.<br />
<strong>VLSI</strong> Research Inc conducts these surveys across sixty major equipment market segments and compiles<br />
competitive positioning reports for each segment. These sixty categories are grouped into the six major<br />
market categories of wafer processing equipment (small and large companies), test equipment, material<br />
handling equipment, process diagnostics equipment, and assembly equipment.<br />
The results were drawn from a distribution of 44,130 questionnaires sent worldwide by mail, email, and<br />
fax in six languages: English, Japanese, Korean, Chinese, German, and French. About one in sixteen<br />
industry employees received a survey. Virtually every chipmaker was given a chance to respond.<br />
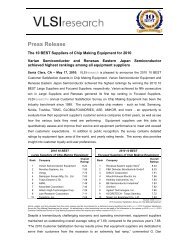
Respondents returned surveys rating 4,505 equipment models. The companies that responded to <strong>VLSI</strong><br />
Research’s customer satisfaction survey represented 95% of worldwide chip production in 2004. When<br />
calculating each of the thirteen separate categories previously mentioned, total responses comprised<br />
about 56,000 individual ratings across the categories, each on a scale of 1 through 10.<br />
Demographic distribution of the equipment ratings returned was 30.1% from North America, 25.0% from<br />
Europe, 10.3% from Japan, 8.3% from Taiwan, 6.9% from China, 6.2% from Korea, and 13.1% from all<br />
other areas of the world.<br />
A new 10 BEST methodology was implemented this year. There are two parts to the new methodology.<br />
The first part is that the qualification rule for the 10 BEST Awards is based on the Respondents’ Share of<br />
Market statistic. This statistic is the sum of share of market held by unique companies responding to the<br />
survey for each specific equipment supplier and equipment type.<br />
The second part of the new 10 BEST methodology is the calculation of the 10 BEST ranking itself. The<br />
rankings are based on the equally weighted average rather than the straight average. This rating is<br />
weighted equally for each unique responding company (not individual survey response). Hence, each<br />
surveyed company only gets “one vote”, based on the average of the individuals from that company<br />
responding to the survey. This rating method has the advantage that no single customer- company can<br />
stuff the ballot box, giving a much more meaningful picture for potential effects on market share.<br />
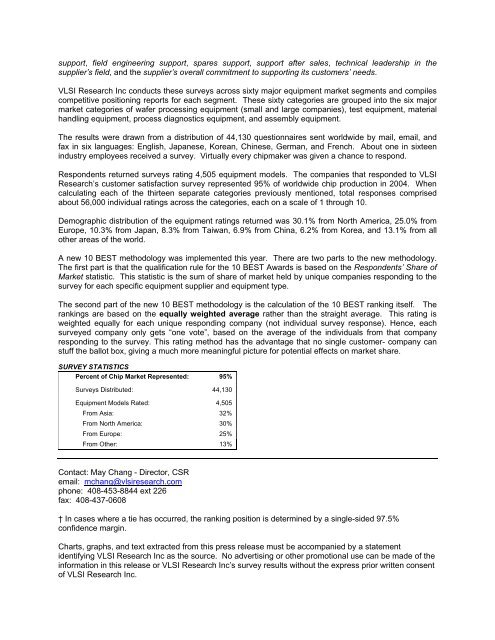
SURVEY STATISTICS<br />
Percent of Chip Market Represented: 95%<br />
Surveys Distributed: 44,130<br />
Equipment Models Rated: 4,505<br />
From Asia: 32%<br />
From North America: 30%<br />
From Europe: 25%<br />
From Other: 13%<br />
Contact: May Chang - Director, CSR<br />
email: mchang@vlsiresearch.com<br />
phone: 408-453-8844 ext 226<br />
fax: 408-437-0608<br />
† In cases where a tie has occurred, the ranking position is determined by a single-sided 97.5%<br />
confidence margin.<br />
Charts, graphs, and text extracted from this press release must be accompanied by a statement<br />
identifying <strong>VLSI</strong> Research Inc as the source. No advertising or other promotional use can be made of the<br />
information in this release or <strong>VLSI</strong> Research Inc’s survey results without the express prior written consent<br />
of <strong>VLSI</strong> Research Inc.