Disney - The Walt Disney Company
Disney - The Walt Disney Company
Disney - The Walt Disney Company

Create successful ePaper yourself
Turn your PDF publications into a flip-book with our unique Google optimized e-Paper software.
Sports Programming Costs <strong>The</strong> <strong>Company</strong> has various contractual<br />
commitments for the purchase of rights for multi-year sports<br />
and other programming arrangements, including the National<br />
Football League, National Basketball Association, National<br />
Association of Stock Car Auto Racing (NASCAR), Major League<br />
Baseball and various college football and basketball conferences<br />
and football bowl games. <strong>The</strong> costs of these contracts have<br />
increased significantly in recent years. We enter into these contractual<br />
commitments with the expectation that, over the life of the<br />
contracts, revenue from advertising during the programming and<br />
affiliate fees will exceed the costs of the programming. While contract<br />
costs may initially exceed incremental revenues and negatively<br />
impact operating income, it is our expectation that the combined<br />
value to our networks from all of these contracts will result in<br />
long-term benefits. <strong>The</strong> actual impact of these contracts on the<br />
<strong>Company</strong>’s results over the term of the contracts is dependent upon<br />
a number of factors, including the strength of advertising markets,<br />
effectiveness of marketing efforts and the size of viewer audiences.<br />
Segment Operating Income Segment operating income<br />
increased 11%, or $480 million, to $4.8 billion for the year due to<br />
an increase of $523 million at the Cable Networks partially offset<br />
by a decrease of $43 million at Broadcasting. <strong>The</strong> increase at the<br />
Cable Networks was primarily due to growth at ESPN, higher<br />
income at our cable equity investments, and increases at ABC<br />
Family and the domestic <strong>Disney</strong> Channels, partially offset by a<br />
favorable settlement of a claim with an international distributor in<br />
the prior year. <strong>The</strong> decrease at Broadcasting was primarily due to<br />
lower advertising revenues at the owned television stations, partially<br />
offset by an improvement at the Internet Group. <strong>The</strong> improvement<br />
at the Internet Group was driven by the absence of costs<br />
related to the <strong>Disney</strong>-branded mobile phone service, partially offset<br />
by higher costs for international mobile and online operations and<br />
<strong>Disney</strong> Online. <strong>The</strong> increase in income at our cable equity investments<br />
was primarily due to higher affiliate and advertising revenue<br />
at Lifetime and a gain on the sale of a European cable channel.<br />
ABC Radio Transaction On June 12, 2007, the <strong>Company</strong> completed<br />
the spin-off of its wholly-owned subsidiary, ABC Radio<br />
Holdings, Inc., which was then merged into a subsidiary of<br />
Citadel Broadcasting Corporation (Citadel). Prior to the spin-off,<br />
the <strong>Company</strong> consolidated its ABC Radio business, consisting of<br />
22 large-market radio stations and the ABC Radio Network businesses,<br />
under ABC Radio Holdings, Inc. <strong>The</strong> transaction did not<br />
include the <strong>Company</strong>’s ESPN Radio or Radio <strong>Disney</strong> network and<br />
station businesses. <strong>The</strong> results of the ABC Radio business have<br />
60<br />
been reported as discontinued operations for all periods presented.<br />
<strong>The</strong> <strong>Company</strong> now includes the ESPN Radio and Radio <strong>Disney</strong><br />
network and stations businesses with Cable Networks in the Media<br />
Networks segment. Prior to the transaction, the <strong>Company</strong>’s radio<br />
businesses were included with Broadcasting in the Media Networks<br />
segment. Previously reported results have been reclassified to<br />
reflect this presentation.<br />
Summarized financial information for the discontinued operations<br />
is as follows (in millions, except per share data):<br />
2007 2006<br />
Revenues $ 372 $ 538<br />
Income from discontinued operations<br />
before income taxes 45 123<br />
Income from discontinued operations,<br />
net of tax 13 70<br />
Diluted EPS, discontinued operations 0.01 0.03<br />
Sale of E! Entertainment Television On November 21, 2006,<br />
in connection with the execution of new long-term agreements for<br />
the provision of programming to cable service provider Comcast<br />
Corporation (Comcast), the <strong>Company</strong> sold its 39.5% interest in E!<br />
Entertainment Television (E!) to Comcast (which owned the remainder<br />
of the interest in E!) for $1.23 billion, which resulted in a pre-tax<br />
gain of $780 million ($487 million after-tax) reported in “Other<br />
(expense) / income”. Equity income from E! was included in Media<br />
Networks segment operating income through the date of the sale.<br />
PARKS AND RESORTS<br />
Revenues Parks and Resorts revenues increased 8%, or $878<br />
million, to $11.5 billion due to increases of $439 million at our<br />
domestic resorts and $439 million at our international resorts.<br />
Domestic Parks and Resorts At our domestic parks and resorts,<br />
revenue growth was primarily due to increases at the <strong>Walt</strong> <strong>Disney</strong><br />
World Resort and <strong>Disney</strong> Vacation Club. Revenue growth at <strong>Walt</strong><br />
<strong>Disney</strong> World Resort was primarily due to increased guest spending<br />
and theme park attendance. Increased guest spending was due to<br />
higher average ticket prices, increased food and beverage sales<br />
and higher average daily hotel room rates. At <strong>Disney</strong> Vacation Club,<br />
revenue growth reflected higher vacation club ownership sales,<br />
including extensions of the term of ownership on existing vacation<br />
home properties.<br />
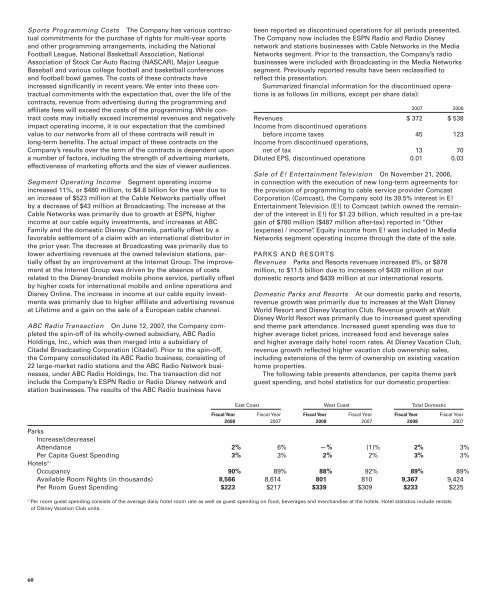
<strong>The</strong> following table presents attendance, per capita theme park<br />
guest spending, and hotel statistics for our domestic properties:<br />
East Coast West Coast Total Domestic<br />
Fiscal Year Fiscal Year Fiscal Year Fiscal Year Fiscal Year Fiscal Year<br />
2008 2007 2008 2007 2008 2007<br />
Parks<br />
Increase/(decrease)<br />
Attendance 2% 6% —% (1)% 2% 3%<br />
Per Capita Guest Spending 3% 3% 2% 2% 3% 3%<br />
Hotels (1)<br />
Occupancy 90% 89% 88% 92% 89% 89%<br />
Available Room Nights (in thousands) 8,566 8,614 801 810 9,367 9,424<br />
Per Room Guest Spending $223 $217 $339 $309 $233 $225<br />
(1) Per room guest spending consists of the average daily hotel room rate as well as guest spending on food, beverages and merchandise at the hotels. Hotel statistics include rentals<br />
of <strong>Disney</strong> Vacation Club units.