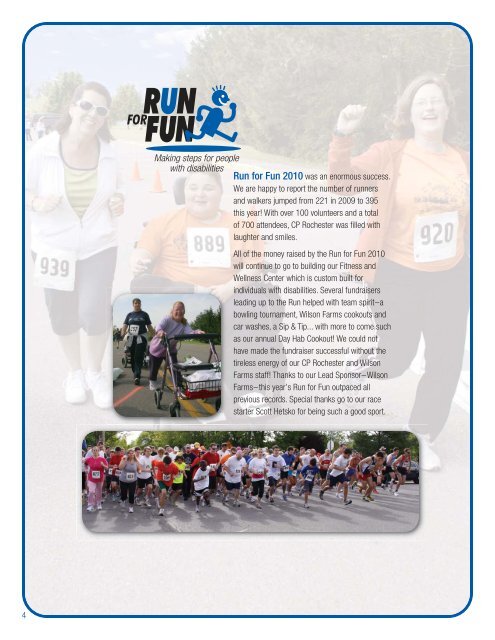
4 Run for Fun 2010 was an enormous success. We are happy to report the number of runners and walkers jumped from 221 in 2009 to 395 this year! With over 100 volunteers and a total of 700 attendees, <strong>CP</strong> <strong>Rochester</strong> was filled with laughter and smiles. All of the money raised by the Run for Fun 2010 will continue to go to building our Fitness and Wellness Center which is custom built for individuals with disabilities. Several fundraisers leading up to the Run helped with team spirit–a bowling tournament, Wilson Farms cookouts and car washes, a Sip & Tip... with more to come such as our annual Day Hab Cookout! We could not have made the fundraiser successful without the tireless energy of our <strong>CP</strong> <strong>Rochester</strong> and Wilson Farms staff! Thanks to our Lead Sponsor–Wilson Farms–this year’s Run for Fun outpaced all previous records. Special thanks go to our race starter Scott Hetsko for being such a good sport.
Consolidated Statement of Activities and Change in Net Assets For the Year Ended December 31, 2009 (with comparative Totals for 2008) % of Total 2009 2008 REVENUE AND SUPPORT Medicaid and other third party payers 72% $12,756,292 $12,037,573 Governmental Support 18% 3,128,177 3,499,755 Self Pay 4% 806,011 698,770 Investment income, net and other income 4% 764,493 (849,087) Public Support Total Revenue and Support 2% ––––——––––– 100% 299,035 –––––––———–––––––––– $17,754,008 276,153 –––––––———–––––––––– $15,663,164 EXPENSES Staffing 72% $12,164,055 $11,691,854 General Operating 20% 3,306,625 3,313,386 Occupancy 6% 1,079,269 1,139,458 Depreciation Total Expenses Change in Net Assets before 2% ––––——––––– 100% 327,070 –––––––———–––––––––– $16,877,019 283,354 –––––––———–––––––––– $16,428,052 Other Changes in Net Assets $876,989 $(764,888) Prior year income/(expense) 193,172 81,908 Change in funded status of pension plan Change in Net Assets 395,419 –––––––———–––––––––– $1,465,580 (1,631,521) –––––––———–––––––––– $(2,314,501) Net Assets—beginning of year Net Assets—end of year 1,862,583 –––––––———–––––––––– $3,328,163 4,177,084 –––––––———–––––––––– $1,862,583 Consolidated Balance Sheet For the Year Ended December 31, 2009 (with comparative Totals for 2008) ASSETS: Current assets $2,742,136 $3,231,051 Fixed assets, net 1,566,822 1,731,451 Other assets 3,904,741 3,254,131 ––––––––––––––––– ––––––––––––––––– Total Assets $8,213,699 $8,216,633 LIABILITIES: Current liabilities $1,573,492 $3,044,831 Long-term liabilities 3,312,044 3,309,219 ––––––––––––––––– ––––––––––––––––– Total Liabilities $4,885,536 $6,354,050 Total Net Assets 3,328,163 1,862,583 ––––––––––––––––– ––––––––––––––––– Total Liabilities and Net Assets $8,213,699 $8,216,633 Audited financial statements for <strong>CP</strong> <strong>Rochester</strong> are available for your information. Please contact the Financial Services Department at 585.334.6000 if you would like to receive a copy. $14,000,000 12 10 8 6 4 2 0 $14,000,000 12 10 8 6 4 2 0 Staffing Medicaid and other third party payers Governmental Support Self Pay 2009 EXPENSES PERCENTAGES $16,877,019 Program services 90.8% Fundraising & Board Designated .4% Administration Services 8.8% FINANCIALS General Operating REVENUE AND SUPPORT Investment income, net and other income Occupancy Public Support EXPENSES Depreciation 5