Clark, B., Lyons, G. and Chatterjee, K. (2012) - UWE Research ...
Clark, B., Lyons, G. and Chatterjee, K. (2012) - UWE Research ...
Clark, B., Lyons, G. and Chatterjee, K. (2012) - UWE Research ...

Create successful ePaper yourself
Turn your PDF publications into a flip-book with our unique Google optimized e-Paper software.
UTSG<br />
January <strong>2012</strong><br />
Aberdeen<br />
CLARK, LYONS, CHATTERJEE: Car ownership<br />
transitions <strong>and</strong> life events<br />
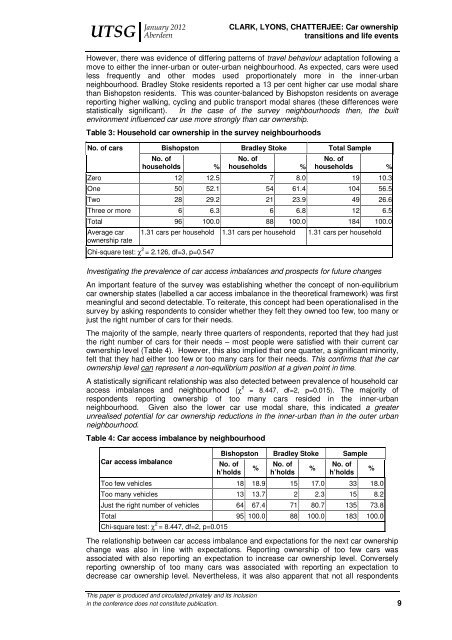
However, there was evidence of differing patterns of travel behaviour adaptation following a<br />
move to either the inner-urban or outer-urban neighbourhood. As expected, cars were used<br />
less frequently <strong>and</strong> other modes used proportionately more in the inner-urban<br />
neighbourhood. Bradley Stoke residents reported a 13 per cent higher car use modal share<br />
than Bishopston residents. This was counter-balanced by Bishopston residents on average<br />
reporting higher walking, cycling <strong>and</strong> public transport modal shares (these differences were<br />
statistically significant). In the case of the survey neighbourhoods then, the built<br />
environment influenced car use more strongly than car ownership.<br />
Table 3: Household car ownership in the survey neighbourhoods<br />
No. of cars<br />
Bishopston Bradley Stoke Total Sample<br />
No. of<br />
households %<br />
No. of<br />
households %<br />
No. of<br />
households %<br />
Zero 12 12.5 7 8.0 19 10.3<br />
One 50 52.1 54 61.4 104 56.5<br />
Two 28 29.2 21 23.9 49 26.6<br />
Three or more 6 6.3 6 6.8 12 6.5<br />
Total 96 100.0 88 100.0 184 100.0<br />
Average car<br />
ownership rate<br />
1.31 cars per household 1.31 cars per household 1.31 cars per household<br />
Chi-square test: χ 2 = 2.126, df=3, p=0.547<br />
Investigating the prevalence of car access imbalances <strong>and</strong> prospects for future changes<br />
An important feature of the survey was establishing whether the concept of non-equilibrium<br />
car ownership states (labelled a car access imbalance in the theoretical framework) was first<br />
meaningful <strong>and</strong> second detectable. To reiterate, this concept had been operationalised in the<br />
survey by asking respondents to consider whether they felt they owned too few, too many or<br />
just the right number of cars for their needs.<br />
The majority of the sample, nearly three quarters of respondents, reported that they had just<br />
the right number of cars for their needs – most people were satisfied with their current car<br />
ownership level (Table 4). However, this also implied that one quarter, a significant minority,<br />
felt that they had either too few or too many cars for their needs. This confirms that the car<br />
ownership level can represent a non-equilibrium position at a given point in time.<br />
A statistically significant relationship was also detected between prevalence of household car<br />
access imbalances <strong>and</strong> neighbourhood (χ 2 = 8.447, df=2, p=0.015). The majority of<br />
respondents reporting ownership of too many cars resided in the inner-urban<br />
neighbourhood. Given also the lower car use modal share, this indicated a greater<br />
unrealised potential for car ownership reductions in the inner-urban than in the outer urban<br />
neighbourhood.<br />
Table 4: Car access imbalance by neighbourhood<br />
Car access imbalance No. of<br />
h’holds<br />
Bishopston Bradley Stoke Sample<br />
This paper is produced <strong>and</strong> circulated privately <strong>and</strong> its inclusion<br />
in the conference does not constitute publication. 9<br />
%<br />
No. of<br />
h’holds<br />
%<br />
No. of<br />
h’holds<br />
Too few vehicles 18 18.9 15 17.0 33 18.0<br />
Too many vehicles 13 13.7 2 2.3 15 8.2<br />
Just the right number of vehicles 64 67.4 71 80.7 135 73.8<br />
Total 95 100.0 88 100.0 183 100.0<br />
Chi-square test: χ 2 = 8.447, df=2, p=0.015<br />
The relationship between car access imbalance <strong>and</strong> expectations for the next car ownership<br />
change was also in line with expectations. Reporting ownership of too few cars was<br />
associated with also reporting an expectation to increase car ownership level. Conversely<br />
reporting ownership of too many cars was associated with reporting an expectation to<br />
decrease car ownership level. Nevertheless, it was also apparent that not all respondents<br />
%