Gaming frequency and academic performance - ascilite
Gaming frequency and academic performance - ascilite
Gaming frequency and academic performance - ascilite

Create successful ePaper yourself
Turn your PDF publications into a flip-book with our unique Google optimized e-Paper software.
366 Australasian Journal of Educational Technology, 2008, 24(4)<br />
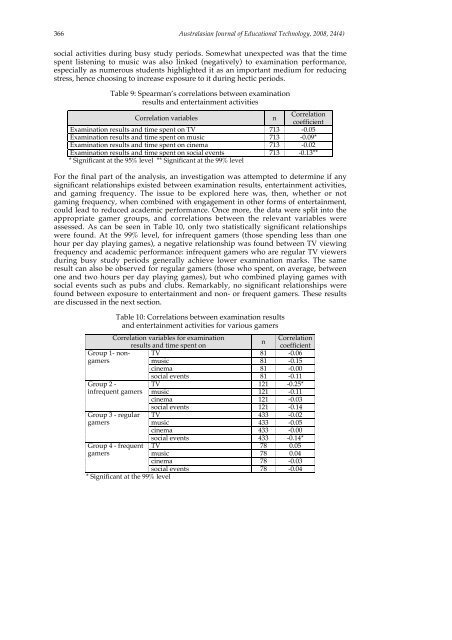
social activities during busy study periods. Somewhat unexpected was that the time<br />
spent listening to music was also linked (negatively) to examination <strong>performance</strong>,<br />
especially as numerous students highlighted it as an important medium for reducing<br />
stress, hence choosing to increase exposure to it during hectic periods.<br />
Table 9: Spearman’s correlations between examination<br />
results <strong>and</strong> entertainment activities<br />
Correlation variables n<br />
Correlation<br />
coefficient<br />
Examination results <strong>and</strong> time spent on TV 713 -0.05<br />
Examination results <strong>and</strong> time spent on music 713 -0.09*<br />
Examination results <strong>and</strong> time spent on cinema 713 -0.02<br />
Examination results <strong>and</strong> time spent on social events<br />
* Significant at the 95% level ** Significant at the 99% level<br />
713 -0.13**<br />
For the final part of the analysis, an investigation was attempted to determine if any<br />
significant relationships existed between examination results, entertainment activities,<br />
<strong>and</strong> gaming <strong>frequency</strong>. The issue to be explored here was, then, whether or not<br />
gaming <strong>frequency</strong>, when combined with engagement in other forms of entertainment,<br />
could lead to reduced <strong>academic</strong> <strong>performance</strong>. Once more, the data were split into the<br />
appropriate gamer groups, <strong>and</strong> correlations between the relevant variables were<br />
assessed. As can be seen in Table 10, only two statistically significant relationships<br />
were found. At the 99% level, for infrequent gamers (those spending less than one<br />
hour per day playing games), a negative relationship was found between TV viewing<br />
<strong>frequency</strong> <strong>and</strong> <strong>academic</strong> <strong>performance</strong>: infrequent gamers who are regular TV viewers<br />
during busy study periods generally achieve lower examination marks. The same<br />
result can also be observed for regular gamers (those who spent, on average, between<br />
one <strong>and</strong> two hours per day playing games), but who combined playing games with<br />
social events such as pubs <strong>and</strong> clubs. Remarkably, no significant relationships were<br />
found between exposure to entertainment <strong>and</strong> non- or frequent gamers. These results<br />
are discussed in the next section.<br />
Table 10: Correlations between examination results<br />
<strong>and</strong> entertainment activities for various gamers<br />
Correlation variables for examination<br />
results <strong>and</strong> time spent on<br />
n<br />
Correlation<br />
coefficient<br />
Group 1- non- TV 81 -0.06<br />
gamers<br />
music 81 -0.15<br />
cinema 81 -0.00<br />
social events 81 -0.11<br />
Group 2 -<br />
TV 121 -0.25*<br />
infrequent gamers music 121 -0.11<br />
cinema 121 -0.03<br />
social events 121 -0.14<br />
Group 3 - regular TV 433 -0.02<br />
gamers<br />
music 433 -0.05<br />
cinema 433 -0.00<br />
social events 433 -0.14*<br />
Group 4 - frequent TV 78 0.05<br />
gamers<br />
music 78 0.04<br />
cinema 78 -0.03<br />
social events 78 -0.04<br />
* Significant at the 99% level