- Page 1:
Advanced Monitoring to Improve Comb
- Page 5:
ABSTRACT Power generators are conce
- Page 8 and 9:
O&M Operations and Maintenance ODBC
- Page 10 and 11:
x Results Fusion...................
- Page 12 and 13:
xii Performance Option.............
- Page 14 and 15:
xiv Detailed Information on Workshe
- Page 16 and 17:
xvi Combustion Turbine Heat Balance
- Page 18 and 19:
xviii Steam Turbine Conditions.....
- Page 20 and 21:
xx Hours-Based Hot Section Calculat
- Page 22 and 23:
xxii Static Waterfall Plots .......
- Page 24 and 25:
Figure 2-30 Training Data Sample fo
- Page 26 and 27:
Figure 6-12 Trend Chart of HP Turbi
- Page 29:
LIST OF TABLES Table 2-1 SCAMP Inpu
- Page 32 and 33:
Introduction Project Objective The
- Page 34 and 35:
Introduction prognostic strategies
- Page 36 and 37:
Introduction stage buckets. These t
- Page 38 and 39:
Sensor Validation and Recovery Modu
- Page 40 and 41:
Sensor Validation and Recovery Modu
- Page 42 and 43:
Sensor Validation and Recovery Modu
- Page 44 and 45:
Sensor Validation and Recovery Modu
- Page 47 and 48:
Sensor Validation The SVRM utilizes
- Page 49 and 50:
Figure 2-9 Architecture Utilized by
- Page 51 and 52:
Figure 2-10 Neural Network Results
- Page 53 and 54:
One final consideration with respec
- Page 55 and 56:
Figure 2-14 Levels of Displacement
- Page 57 and 58:
The addition of the sensor recovery
- Page 59 and 60:
information concerning sensor anoma
- Page 61 and 62:
Figure 2-20 Generator Output Power
- Page 63 and 64:
Figure 2-25 Program Tab of the Conf
- Page 65 and 66:
Figure 2-27 Batch Analysis Tab of t
- Page 67 and 68:
however, impractical to monitor on
- Page 69 and 70:
networks’ ability to generalize a
- Page 71 and 72:
Rule 1: IF T1 IS warm OR T2 IS warm
- Page 73 and 74:
3 COMBUSTION TURBINE PERFORMANCE AN
- Page 75 and 76:
CTPFDM Development Philosophy Sever
- Page 77 and 78:
3-5 CTPDM Input Data Files DCS 3 2
- Page 79 and 80:
3-7 the bottom of the screen. When
- Page 81 and 82:
• Status.sys, a text file contain
- Page 83 and 84:
3-11 Program Files CTPFDM CTPFDM.XL
- Page 85 and 86:
CTPFDM Directory The directory wher
- Page 87 and 88:
Remove CT Model To remove an existi
- Page 89 and 90:
Get ISO Conditions This button, whe
- Page 91 and 92:
If the user makes changes to the da
- Page 93 and 94:
Reference Conditions for Rating Ent
- Page 95 and 96:
Heat Rate 0.1-2 Flow 0.1-2 Compress
- Page 97 and 98:
First Nozzle Cooling Air 0-0.33 Com
- Page 99 and 100:
Acceptable Ranges The following tab
- Page 101 and 102:
CTPFDM DLL (as is done in off-line
- Page 103 and 104:
Detailed Information on Worksheets
- Page 105 and 106:
3-33 Pressure Ratio 18 16 14 12 10
- Page 107 and 108:
CTPFDM units, they will be converte
- Page 109 and 110:
Inputs Row # 3-37 Table 3-4 Continu
- Page 111 and 112:
the IGV measurement is not availabl
- Page 113 and 114:
indicator flag will be set to "yes"
- Page 115 and 116:
Note that the Total Number of Wheel
- Page 117 and 118:
Corrected Site Conditions The fourt
- Page 119 and 120:
3-47 Table 3-5 Format of Missinp.da
- Page 121:
CTPDM Version 3.2 Gas Turbine Perfo
- Page 124 and 125:
Combustion Turbine Performance and
- Page 126 and 127:
Combustion Turbine Performance and
- Page 128 and 129:
Combustion Turbine Performance and
- Page 130 and 131:
Combustion Turbine Performance and
- Page 132 and 133:
Combustion Turbine Performance and
- Page 134 and 135:
Combustion Turbine Performance and
- Page 136 and 137:
Combustion Turbine Performance and
- Page 138 and 139:
Combustion Turbine Performance and
- Page 140 and 141:
Combustion Turbine Performance and
- Page 142 and 143:
Combustion Turbine Performance and
- Page 144 and 145:
Combustion Turbine Performance and
- Page 146 and 147:
Combustion Turbine Performance and
- Page 148 and 149:
Combustion Turbine Performance and
- Page 150 and 151:
Combustion Turbine Performance and
- Page 153 and 154:
Some fault diagnostics are based on
- Page 155 and 156:
The air splits are treated as a fra
- Page 157 and 158:
The following definitions are used
- Page 159 and 160:
WCI ∗ (HCD − H1REF) + WF ∗ (H
- Page 161:
methods rely on different measureme
- Page 164 and 165:
combined Cycle Performance and Faul
- Page 166 and 167:
combined Cycle Performance and Faul
- Page 168 and 169:
combined Cycle Performance and Faul
- Page 170 and 171:
combined Cycle Performance and Faul
- Page 172 and 173:
combined Cycle Performance and Faul
- Page 174 and 175:
combined Cycle Performance and Faul
- Page 176 and 177:
combined Cycle Performance and Faul
- Page 178 and 179:
combined Cycle Performance and Faul
- Page 180 and 181:
combined Cycle Performance and Faul
- Page 182 and 183:
combined Cycle Performance and Faul
- Page 184 and 185:
combined Cycle Performance and Faul
- Page 186 and 187:
combined Cycle Performance and Faul
- Page 188 and 189:
combined Cycle Performance and Faul
- Page 190 and 191:
combined Cycle Performance and Faul
- Page 192 and 193:
combined Cycle Performance and Faul
- Page 194 and 195:
combined Cycle Performance and Faul
- Page 196 and 197:
combined Cycle Performance and Faul
- Page 198 and 199:
combined Cycle Performance and Faul
- Page 200 and 201:
combined Cycle Performance and Faul
- Page 202 and 203:
combined Cycle Performance and Faul
- Page 204 and 205:
combined Cycle Performance and Faul
- Page 206 and 207:
combined Cycle Performance and Faul
- Page 208 and 209:
combined Cycle Performance and Faul
- Page 210 and 211:
combined Cycle Performance and Faul
- Page 212 and 213:
combined Cycle Performance and Faul
- Page 214 and 215:
combined Cycle Performance and Faul
- Page 216 and 217:
combined Cycle Performance and Faul
- Page 218 and 219:
combined Cycle Performance and Faul
- Page 220 and 221:
combined Cycle Performance and Faul
- Page 222 and 223:
Start-Up Diagnostics Module (SUDM),
- Page 224 and 225:
Start-Up Diagnostics Module (SUDM),
- Page 226 and 227:
Start-Up Diagnostics Module (SUDM),
- Page 228 and 229:
Start-Up Diagnostics Module (SUDM),
- Page 230 and 231:
Start-Up Diagnostics Module (SUDM),
- Page 232 and 233:
Start-Up Diagnostics Module (SUDM),
- Page 234 and 235:
Start-Up Diagnostics Module (SUDM),
- Page 236 and 237:
Start-Up Diagnostics Module (SUDM),
- Page 238 and 239:
Start-Up Diagnostics Module (SUDM),
- Page 240 and 241:
Start-Up Diagnostics Module (SUDM),
- Page 242 and 243:
Start-Up Diagnostics Module (SUDM),
- Page 244 and 245:
Start-Up Diagnostics Module (SUDM),
- Page 246 and 247:
Start-Up Diagnostics Module (SUDM),
- Page 248 and 249:
Remaining Life Module Report (RLM),
- Page 250 and 251:
Remaining Life Module Report (RLM),
- Page 252 and 253:
Remaining Life Module Report (RLM),
- Page 254 and 255:
Remaining Life Module Report (RLM),
- Page 256 and 257:
Remaining Life Module Report (RLM),
- Page 258 and 259:
Remaining Life Module Report (RLM),
- Page 260 and 261:
Remaining Life Module Report (RLM),
- Page 262 and 263:
Remaining Life Module Report (RLM),
- Page 264 and 265:
Remaining Life Module Report (RLM),
- Page 266 and 267:
Remaining Life Module Report (RLM),
- Page 268 and 269: Remaining Life Module Report (RLM),
- Page 270 and 271: Remaining Life Module Report (RLM),
- Page 272 and 273: Remaining Life Module Report (RLM),
- Page 274 and 275: Remaining Life Module Report (RLM),
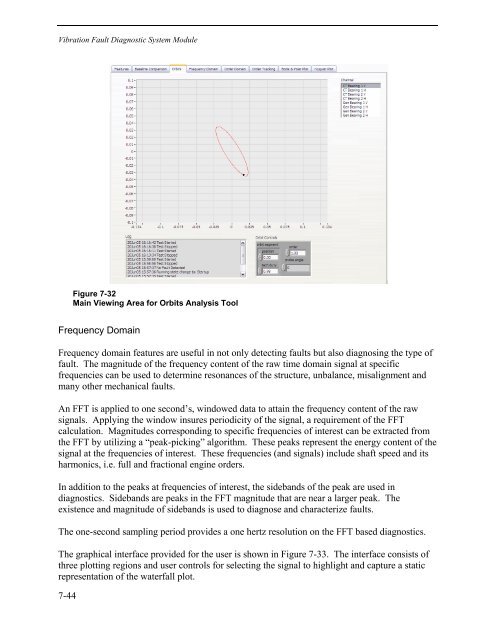
- Page 276 and 277: Vibration Fault Diagnostic System M
- Page 278 and 279: Vibration Fault Diagnostic System M
- Page 280 and 281: Vibration Fault Diagnostic System M
- Page 282 and 283: Vibration Fault Diagnostic System M
- Page 284 and 285: Vibration Fault Diagnostic System M
- Page 286 and 287: Vibration Fault Diagnostic System M
- Page 288 and 289: Vibration Fault Diagnostic System M
- Page 290 and 291: Vibration Fault Diagnostic System M
- Page 292 and 293: Vibration Fault Diagnostic System M
- Page 294 and 295: Vibration Fault Diagnostic System M
- Page 296 and 297: Vibration Fault Diagnostic System M
- Page 298 and 299: Vibration Fault Diagnostic System M
- Page 300 and 301: Vibration Fault Diagnostic System M
- Page 302 and 303: Vibration Fault Diagnostic System M
- Page 304 and 305: Vibration Fault Diagnostic System M
- Page 306 and 307: Vibration Fault Diagnostic System M
- Page 308 and 309: Vibration Fault Diagnostic System M
- Page 310 and 311: Vibration Fault Diagnostic System M
- Page 312 and 313: Vibration Fault Diagnostic System M
- Page 314 and 315: Vibration Fault Diagnostic System M
- Page 316 and 317: Vibration Fault Diagnostic System M
- Page 320 and 321: Vibration Fault Diagnostic System M
- Page 322 and 323: Vibration Fault Diagnostic System M
- Page 324 and 325: Vibration Fault Diagnostic System M
- Page 326 and 327: Vibration Fault Diagnostic System M