CONSOLIDATING IN OUTSIDE BROADCAST GROWING IN ... - EVS
CONSOLIDATING IN OUTSIDE BROADCAST GROWING IN ... - EVS
CONSOLIDATING IN OUTSIDE BROADCAST GROWING IN ... - EVS

Create successful ePaper yourself
Turn your PDF publications into a flip-book with our unique Google optimized e-Paper software.
KeY<br />
FIGuRes<br />
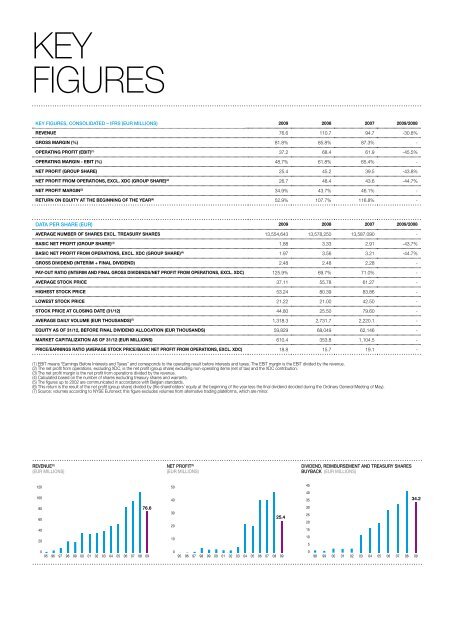
KEY FIGURES, CONSOLIDATED – IFRS (EUR MILLIONS) 2009 2008 2007 2009/2008<br />
reVenue 76.6 110.7 94.7 -30.8%<br />
gross margin (%) 81.8% 85.8% 87.3% -<br />
operaTing profiT (ebiT) (1) 37.2 68.4 61.9 -45.5%<br />
operaTing margin - ebiT (%) 48.7% 61.8% 65.4% -<br />
neT profiT (group share) 25.4 45.2 39.5 -43.8%<br />
neT profiT from operaTions, excl. xdc (group share) (2) 26.7 48.4 43.6 -44.7%<br />
neT profiT margin (3) 34.9% 43.7% 46.1% -<br />
reTurn on equiTy aT The beginning of The year (6) 52.9% 107.7% 116.8% -<br />
DATA PER SHARE (EUR) 2009 2008 2007 2009/2008<br />
aVerage number of shares excl. Treasury shares 13,554,643 13,578,250 13,587,090 -<br />
basic neT profiT (group share) (4) 1.88 3.33 2.91 -43.7%<br />
basic neT profiT from operaTions, excl. xdc (group share) (4) 1.97 3.56 3.21 -44.7%<br />
gross diVidend (inTerim + final diVidend) 2.48 2.48 2.28 -<br />
pay-ouT raTio (inTerim and final gross diVidends/neT profiT from operaTions, excl. xdc) 125.9% 69.7% 71.0% -<br />
aVerage sTock price 37.11 55.78 61.27 -<br />
highesT sTock price 53.24 80.39 83.86 -<br />
lowesT sTock price 21.22 21.00 42.50 -<br />
sTock price aT closing daTe (31/12) 44.80 25.50 79.60 -<br />
aVerage daily Volume (eur Thousands) (7) 1,318.3 2,731.7 2,220.1 -<br />
equiTy as of 31/12, before final diVidend allocaTion (eur Thousands) 59,829 68,049 62,146 -<br />
markeT capiTalizaTion as of 31/12 (eur millions) 610.4 353.8 1,104.5 -<br />
price/earnings raTio (aVerage sTock price/basic neT profiT from operaTions, excl. xdc) 18.8 15.7 19.1 -<br />
(1) EBIt means “Earnings Before Interests and taxes” and corresponds to the operating result before interests and taxes. the EBIt margin is the EBIt divided by the revenue.<br />
(2) the net profit from operations, excluding XDc, is the net profit (group share) excluding non-operating items (net of tax) and the XDc contribution.<br />
(3) the net profit margin is the net profit from operations divided by the revenue.<br />
(4) calculated based on the number of shares excluding treasury shares and warrants.<br />
(5) the figures up to 2002 are communicated in accordance with Belgian standards.<br />
(6) this return is the result of the net profit (group share) divided by (the shareholders’ equity at the beginning of the year less the final dividend decided during the ordinary General meeting of may).<br />
(7) Source: volumes according to NySE Euronext; this figure excludes volumes from alternative trading plateforms, which are minor.<br />
REVENUE (5)<br />
(EUR MILLIONS)<br />
120<br />
100<br />
80<br />
60<br />
40<br />
20<br />
0<br />
95 96<br />
97<br />
98<br />
99<br />
00<br />
01<br />
02<br />
03<br />
04<br />
05<br />
06<br />
07<br />
08<br />
76.6<br />
09<br />
NET PROFIT (5)<br />
(EUR MILLIONS)<br />
50<br />
40<br />
30<br />
20<br />
10<br />
0<br />
95 96<br />
97<br />
98<br />
99<br />
00<br />
01<br />
02<br />
03<br />
04<br />
05<br />
06<br />
07<br />
08<br />
25.4<br />
09<br />
DIVIDEND, REIMBURSEMENT AND TREASURY SHARES<br />
BUYBACK (EUR MILLIONS)<br />
45<br />
40<br />
35<br />
30<br />
25<br />
20<br />
15<br />
10<br />
5<br />
0<br />
34.2<br />
98 99 00 01 02 03 04 05 06 07 08 09