5-Year Strategic Economic Development Plan - Deltona
5-Year Strategic Economic Development Plan - Deltona
5-Year Strategic Economic Development Plan - Deltona

You also want an ePaper? Increase the reach of your titles
YUMPU automatically turns print PDFs into web optimized ePapers that Google loves.
THE CITY OF DELTONA<br />
STRATEGIC ECONOMIC DEVELOPMENT PLAN<br />
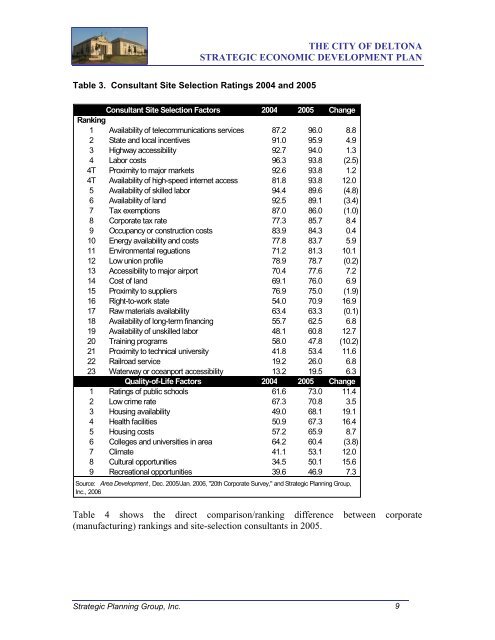
Table 3. Consultant Site Selection Ratings 2004 and 2005<br />
Consultant Site Selection Factors<br />
Ranking<br />
2004 2005 Change<br />
1 Availability of telecommunications services 87.2 96.0 8.8<br />
2 State and local incentives 91.0 95.9 4.9<br />
3 Highway accessibility 92.7 94.0 1.3<br />
4 Labor costs 96.3 93.8 (2.5)<br />
4T Proximity to major markets 92.6 93.8 1.2<br />
4T Availability of high-speed internet access 81.8 93.8 12.0<br />
5 Availability of skilled labor 94.4 89.6 (4.8)<br />
6 Availability of land 92.5 89.1 (3.4)<br />
7 Tax exemptions 87.0 86.0 (1.0)<br />
8 Corporate tax rate 77.3 85.7 8.4<br />
9 Occupancy or construction costs 83.9 84.3 0.4<br />
10 Energy availability and costs 77.8 83.7 5.9<br />
11 Environmental reguations 71.2 81.3 10.1<br />
12 Low union profile 78.9 78.7 (0.2)<br />
13 Accessibility to major airport 70.4 77.6 7.2<br />
14 Cost of land 69.1 76.0 6.9<br />
15 Proximity to suppliers 76.9 75.0 (1.9)<br />
16 Right-to-work state 54.0 70.9 16.9<br />
17 Raw materials availability 63.4 63.3 (0.1)<br />
18 Availability of long-term financing 55.7 62.5 6.8<br />
19 Availability of unskilled labor 48.1 60.8 12.7<br />
20 Training programs 58.0 47.8 (10.2)<br />
21 Proximity to technical university 41.8 53.4 11.6<br />
22 Railroad service 19.2 26.0 6.8<br />
23 Waterway or oceanport accessibility 13.2 19.5 6.3<br />
Quality-of-Life Factors<br />
2004 2005 Change<br />
1 Ratings of public schools 61.6 73.0 11.4<br />
2 Low crime rate 67.3 70.8 3.5<br />
3 Housing availability 49.0 68.1 19.1<br />
4 Health facilities 50.9 67.3 16.4<br />
5 Housing costs 57.2 65.9 8.7<br />
6 Colleges and universities in area 64.2 60.4 (3.8)<br />
7 Climate 41.1 53.1 12.0<br />
8 Cultural opportunities 34.5 50.1 15.6<br />
9 Recreational opportunities 39.6 46.9 7.3<br />
Source: Area <strong>Development</strong> , Dec. 2005/Jan. 2006, "20th Corporate Survey," and <strong>Strategic</strong> <strong>Plan</strong>ning Group,<br />
Inc., 2006<br />
Table 4 shows the direct comparison/ranking difference between corporate<br />
(manufacturing) rankings and site-selection consultants in 2005.<br />
<strong>Strategic</strong> <strong>Plan</strong>ning Group, Inc. 9