Office Space Across the World 2011 - Bayleys
Office Space Across the World 2011 - Bayleys
Office Space Across the World 2011 - Bayleys

Create successful ePaper yourself
Turn your PDF publications into a flip-book with our unique Google optimized e-Paper software.
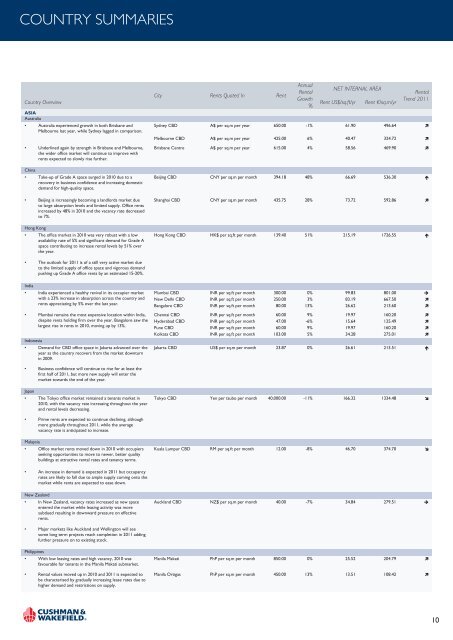
COUNTRY SUMMARIES<br />
Country Overview<br />
ASIA<br />
Australia<br />
City Rents Quoted In Rent<br />
Annual<br />
Rental<br />
Growth<br />
%<br />
NET INTERNAL AREA<br />
Rent US$/sq.ft/yr Rent €/sq.m/yr<br />
Rental<br />
Trend <strong>2011</strong><br />
• Australia experienced growth in both Brisbane and<br />
Melbourne last year, while Sydney lagged in comparison.<br />
Sydney CBD A$ per sq.m per year 650.00 -1% 61.90 496.64 �<br />
Melbourne CBD A$ per sq.m per year 425.00 6% 40.47 324.72 �<br />
• Underlined again by strength in Brisbane and Melbourne,<br />
<strong>the</strong> wider office market will continue to improve with<br />
rents expected to slowly rise fur<strong>the</strong>r.<br />
China<br />
• Take-up of Grade A space surged in 2010 due to a<br />
recovery in business confidence and increasing domestic<br />
demand for high-quality space.<br />
• Beijing is increasingly becoming a landlords market due<br />
to large absorption levels and limited supply. <strong>Office</strong> rents<br />
increased by 48% in 2010 and <strong>the</strong> vacancy rate decreased<br />
to 7%.<br />
Hong Kong<br />
• The office market in 2010 was very robust with a low<br />
availability rate of 5% and significant demand for Grade A<br />
space contributing to increase rental levels by 51% over<br />
<strong>the</strong> year.<br />
• The outlook for <strong>2011</strong> is of a still very active market due<br />
to <strong>the</strong> limited supply of office space and vigorous demand<br />
pushing up Grade A office rents by an estimated 15-20%.<br />
India<br />
• India experienced a healthy revival in its occupier market<br />
with a 23% increase in absorption across <strong>the</strong> country and<br />
rents appreciating by 5% over <strong>the</strong> last year.<br />
• Mumbai remains <strong>the</strong> most expensive location within India,<br />
despite rents holding firm over <strong>the</strong> year. Bangalore saw <strong>the</strong><br />
largest rise in rents in 2010, moving up by 13%.<br />
Indonesia<br />
• Demand for CBD office space in Jakarta advanced over <strong>the</strong><br />
year as <strong>the</strong> country recovers from <strong>the</strong> market downturn<br />
in 2009.<br />
• Business confidence will continue to rise for at least <strong>the</strong><br />
first half of <strong>2011</strong>, but more new supply will enter <strong>the</strong><br />
market towards <strong>the</strong> end of <strong>the</strong> year.<br />
Japan<br />
• The Tokyo office market remained a tenants market in<br />
2010, with <strong>the</strong> vacancy rate increasing throughout <strong>the</strong> year<br />
and rental levels decreasing.<br />
• Prime rents are expected to continue declining, although<br />
more gradually throughout <strong>2011</strong>, while <strong>the</strong> average<br />
vacancy rate is anticipated to increase.<br />
Malaysia<br />
• <strong>Office</strong> market rents moved down in 2010 with occupiers<br />
seeking opportunities to move to newer, better quality<br />
buildings at attractive rental rates and tenancy terms.<br />
• An increase in demand is expected in <strong>2011</strong> but occupancy<br />
rates are likely to fall due to ample supply coming onto <strong>the</strong><br />
market while rents are expected to ease down.<br />
New Zealand<br />
• In New Zealand, vacancy rates increased as new space<br />
entered <strong>the</strong> market while leasing activity was more<br />
subdued resulting in downward pressure on effective<br />
rents.<br />
• Major markets like Auckland and Wellington will see<br />
some long term projects reach completion in <strong>2011</strong> adding<br />
fur<strong>the</strong>r pressure on to existing stock.<br />
Philippines<br />
• With low leasing rates and high vacancy, 2010 was<br />
favourable for tenants in <strong>the</strong> Manila Makati submarket.<br />
• Rental values moved up in 2010 and <strong>2011</strong> is expected to<br />
be characterised by gradually increasing lease rates due to<br />
higher demand and restrictions on supply.<br />
Brisbane Centre A$ per sq.m per year 615.00 4% 58.56 469.90 �<br />
Beijing CBD CNY per sq.m per month 394.18 48% 66.69 536.30 �<br />
Shanghai CBD CNY per sq.m per month 435.75 28% 73.72 592.86 �<br />
Hong Kong CBD HK$ per sq.ft per month 139.40 51% 215.19 1726.55 �<br />
Mumbai CBD INR per sq.ft per month 300.00 0% 99.83 801.00 �<br />
New Delhi CBD INR per sq.ft per month 250.00 3% 83.19 667.50 �<br />
Bangalore CBD INR per sq.ft per month 80.00 13% 26.62 213.60 �<br />
Chennai CBD INR per sq.ft per month 60.00 9% 19.97 160.20 �<br />
Hyderabad CBD INR per sq.ft per month 47.00 -6% 15.64 125.49 �<br />
Pune CBD INR per sq.ft per month 60.00 9% 19.97 160.20 �<br />
Kolkata CBD INR per sq.ft per month 103.00 5% 34.28 275.01 �<br />
Jakarta CBD US$ per sq.m per month 23.87 0% 26.61 213.51 �<br />
Tokyo CBD Yen per tsubo per month 40,000.00 -11% 166.32 1334.48 �<br />
Kuala Lumpur CBD RM per sq.ft per month 12.00 -8% 46.70 374.70 �<br />
Auckland CBD NZ$ per sq.m per month 40.00 -7% 34.84 279.51 �<br />
Manila Makati PhP per sq.m per month 850.00 0% 25.52 204.79 �<br />
Manila Ortigas PhP per sq.m per month 450.00 13% 13.51 108.42 �<br />
10