Download - Benteler
Download - Benteler
Download - Benteler
- TAGS
- download
- benteler
- benteler.com

You also want an ePaper? Increase the reach of your titles
YUMPU automatically turns print PDFs into web optimized ePapers that Google loves.
MANAGEMENT REPORT<br />
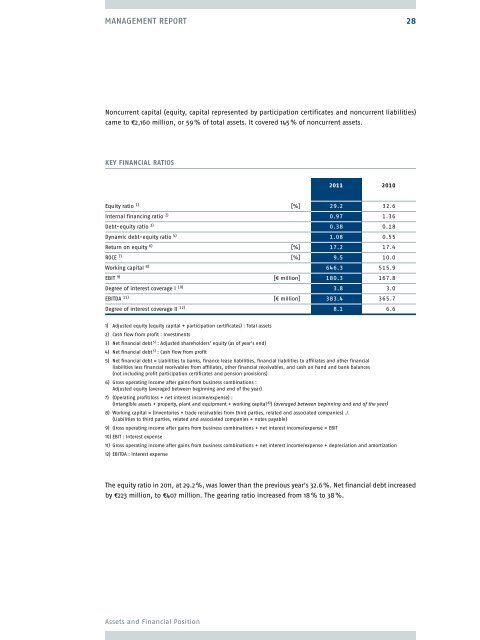
Noncurrent capital (equity, capital represented by participation certificates and noncurrent liabilities)<br />
came to €2,160 million, or 59 % of total assets. It covered 145 % of noncurrent assets.<br />
keY FInAnCIAl RAtIoS<br />
2011 2010<br />
Equity ratio 1) [%] 29.2 32.6<br />
Internal financing ratio 2) 0.97 1.36<br />
Debt-equity ratio 3) 0.38 0.18<br />
Dynamic debt-equity ratio 4) 1.08 0.55<br />
Return on equity 6) [%] 17.2 17.4<br />
ROCE 7) [%] 9.5 10.0<br />
Working capital 8) 646.3 515.9<br />
EBIT 9) [€ million] 180.3 167.8<br />
Degree of interest coverage I 10) 3.8 3.0<br />
EBITDA 11) [€ million] 383.4 365.7<br />
Degree of interest coverage II 12) 8.1 6.6<br />
1) Adjusted equity (equity capital + participation certificates) : Total assets<br />
2) Cash flow from profit : Investments<br />
3) Net financial debt 5) : Adjusted shareholders’ equity (as of year’s end)<br />
4) Net financial debt 5) : Cash flow from profit<br />
5) Net financial debt = Liabilities to banks, finance lease liabilities, financial liabilities to affiliates and other financial<br />
liabilities less financial receivables from affiliates, other financial receivables, and cash on hand and bank balances<br />
(not including profit participation certificates and pension provisions)<br />
6) Gross operating income after gains from business combinations :<br />
Adjusted equity (averaged between beginning and end of the year)<br />
7) (Operating profit/loss + net interest income/expense) :<br />
(Intangible assets + property, plant and equipment + working capital 8) ) (averaged between beginning and end of the year)<br />
8) Working capital = (Inventories + trade receivables from third parties, related and associated companies) ./.<br />
(Liabilities to third parties, related and associated companies + notes payable)<br />
9) Gross operating income after gains from business combinations + net interest income/expense = EBIT<br />
10) EBIT : Interest expense<br />
11) Gross operating income after gains from business combinations + net interest income/expense + depreciation and amortization<br />
12) EBITDA : Interest expense<br />
The equity ratio in 2011, at 29.2 %, was lower than the previous year’s 32.6 %. Net financial debt increased<br />
by €223 million, to €407 million. The gearing ratio increased from 18 % to 38 %.<br />
Assets and Financial Position<br />
28