Community Health Index - Lithium
Community Health Index - Lithium
Community Health Index - Lithium

Create successful ePaper yourself
Turn your PDF publications into a flip-book with our unique Google optimized e-Paper software.
community health index<br />
for online communities
contents<br />
1 executive summary<br />
2 intro<br />
3 defining health factors for online communities<br />
5 using community health factors to drive action<br />
7 using the community health index as a community standard<br />
11 conclusion<br />
12 defining the CHI health factors<br />
15 computing the community health index<br />
we help companies unlock the passion of their customers.<br />
The <strong>Lithium</strong> Social Customer Suite allows brands to build vibrant customer communities that:<br />
lithium.com | © 2012 <strong>Lithium</strong> Technologies, Inc. All Rights Reserved<br />
share this whitepaper<br />
2
executive summary<br />
In the current economic climate, companies are discovering that<br />
their online communities have become a powerful and costeffective<br />
vehicle for interacting with customers. For example,<br />
a consumer electronics community that runs on the <strong>Lithium</strong><br />
platform recently reported 1.4 million deflected support calls,<br />
resulting in an annual estimated savings of $10 million.<br />
Savings like these have clearly transformed online customer<br />
communities into vital enterprise assets, which makes<br />
monitoring their health increasingly important to corporate<br />
wellbeing. However, until now there has been no simple,<br />
common way to do so effectively, no standard by which to<br />
evaluate or take action on the myriad of metrics used to<br />
capture every aspect of community activity and performance.<br />
Imagine a discussion of credit-worthiness before the<br />
introduction of the FICO ® score.<br />
<strong>Lithium</strong>, the leading provider of Social Customer solutions<br />
that deliver real business results, offers a solution. <strong>Lithium</strong><br />
has recently completed a detailed, time-series analysis of<br />
up to a decade’s worth of proprietary data that represents<br />
billions of actions, millions of users, and scores of<br />
communities. This research, coupled with our acknowledged<br />
expertise in planning, deploying, and managing customer<br />
communities, enabled us to identify and calculate key factors<br />
that contribute to a new standard for measuring community<br />
health: the <strong>Community</strong> <strong>Health</strong> <strong>Index</strong>.<br />
share this whitepaper<br />
By analyzing hundreds of metrics from communities of<br />
varying types, sizes, and ages, we identified the diagnostic and<br />
predictive metrics that most accurately represent key attributes<br />
of a healthy community: growth, useful content, popularity,<br />
responsiveness, interactivity, and liveliness. Although we<br />
uncovered other metrics that proved to be even more predictive<br />
of community health, the ones we selected as the basis for<br />
calculating the <strong>Community</strong> <strong>Health</strong> <strong>Index</strong> are readily available<br />
for most online communities across the industry.<br />
Smoothed and normalized for community purpose, size,<br />
and age, the <strong>Community</strong> <strong>Health</strong> <strong>Index</strong> provides a single<br />
representation of community health. Deconstructed, its<br />
constituent health factors enable community managers to take<br />
specific action and measure the results. This paper describes<br />
these health factors and explains how to use them to calculate<br />
a <strong>Community</strong> <strong>Health</strong> <strong>Index</strong>. Although the source community<br />
data is proprietary, <strong>Lithium</strong> freely offers the results of our<br />
research toward a common standard for the industry.<br />
1
intro<br />
Online customer communities have come a long way in the<br />
thirty years since a handful of hobbyists posted messages on<br />
the first public bulletin boards. For an increasing number of<br />
companies, they have become an important tool for engaging<br />
with their customers and driving sales.<br />
In a recent study published in the Harvard Business Review,<br />
researchers found that community participants at an online<br />
auction site both bought and sold more, generating on<br />
average 56% more in sales than non-community users.<br />
This increased activity translated into several million dollars<br />
in profit over the course of a year. Likewise, a community<br />
running on the <strong>Lithium</strong> platform recently reported both a 41%<br />
increase in sales by community members and an $8 million<br />
savings in support costs.<br />
Results such as these demonstrate the return on investment<br />
for healthy and successful communities: customers are<br />
getting what they need from the communities, which, in turn,<br />
allows the communities to meet the goals of the companies<br />
that sponsor them. The ROI that online communities<br />
are capable of delivering makes it all the more essential<br />
that companies be able to measure the health of their<br />
communities and take action to keep them healthy.<br />
Measurement, however, has proved to be a challenge because<br />
of the missing component: a single industry standard—like<br />
the FICO score, Body-Mass <strong>Index</strong>, or standardized test scores,<br />
for example—that allows communities to gauge their health<br />
in absolute objective terms. As the result of a massive data<br />
analysis project, <strong>Lithium</strong> has developed such a standard, the<br />
share this whitepaper<br />
<strong>Community</strong> <strong>Health</strong> <strong>Index</strong>. The development of the <strong>Community</strong><br />
<strong>Health</strong> <strong>Index</strong> is based on data aggregated from a wide range<br />
of communities representing more than 15 billion actions<br />
and 6 million users. In order to make it universally applicable,<br />
the <strong>Community</strong> <strong>Health</strong> <strong>Index</strong> is normalized for community<br />
purpose, size, and age.<br />
Like a low FICO score or high BMI, a low <strong>Community</strong> <strong>Health</strong><br />
<strong>Index</strong> value points to the need for a change in behavior. And,<br />
like the components of standardized tests, deconstruction<br />
of the <strong>Community</strong> <strong>Health</strong> <strong>Index</strong> into specific health factors<br />
points to specific areas within the community that require<br />
corrective action. This deconstruction even extends to<br />
different levels within a community, where we can identify the<br />
less healthy subdivisions and the conditions that are affecting<br />
their health. With information such as this, a company can<br />
target its efforts and resources to make the specific changes<br />
most likely to further improve the community’s health.<br />
In the spirit of Mr. Fair and Mr. Isaac, the National Institutes of<br />
<strong>Health</strong>, and generations of high school English teachers, we<br />
offer the <strong>Community</strong> <strong>Health</strong> <strong>Index</strong> as an open measurement<br />
for community health.<br />
2
defining health<br />
factors for online<br />
communities<br />
Good health and good sense are two of life’s<br />
greatest blessings.<br />
-Publius Syrus, Maxim 827<br />
<strong>Health</strong> in an online customer community, like health in<br />
an individual, is spread across a broad spectrum. And as<br />
Charles Atlas and the 97-pound weakling illustrate, some<br />
communities are stronger and healthier than others. But,<br />
no matter how good we look or how robust we feel at the<br />
moment, there is always room for improvement.<br />
Humans enjoy the benefit of sophisticated diagnostic and<br />
preventive medicine, which tells us where we need to<br />
improve. In order to get the most out of online communities,<br />
we need similar diagnostics to help us make better use of the<br />
data currently available for measuring community activity and<br />
performance. Armed with the right data and with standards<br />
that allow us to evaluate that data objectively, we can then<br />
formulate a plan for improving community health.<br />
Based on our continuous engagement with successful online<br />
communities, we were able to identify a common set of<br />
characteristics shared by healthy communities of all types,<br />
sizes, and ages: they are growing, useful, popular, responsive,<br />
interactive, lively, and positive. Furthermore, analysis of the<br />
vast body of data available to us allowed us to then define<br />
specific health factors that most accurately represent<br />
each characteristic.<br />
The characteristics of healthy communities and their<br />
corresponding health factors are:<br />
share this whitepaper<br />
Growing = Members. After an initial surge of registrations<br />
characteristic of a newly-launched community, membership<br />
in a healthy community continues to grow. Although mature<br />
communities typically experience a slower rate of growth,<br />
they still add new members as the company’s customer base<br />
grows. The traditional method for measuring membership is<br />
the registration count. 1<br />
Useful = Content. A critical mass of content posted on an<br />
online community is clearly one of its strongest attractions to<br />
both members and casual visitors. In support communities,<br />
the content enables participants to arrive at a general<br />
understanding or get answers to specific questions. In<br />
engagement (enthusiast or marketing) communities, it serves<br />
as a magnet to attract and engage members. In listening<br />
communities, the content posted by community members<br />
gives the company valuable input from the customers who<br />
use their products or services.<br />
A steady infusion of useful content, then, is essential to the<br />
health of a community. 2 The traditional metric for measuring<br />
content is number of posts. This metric alone, however, gives<br />
no indication of the usefulness of the content, especially in<br />
communities that do not use content rating or tagging. In<br />
order to model content usefulness instead of sheer bulk, we<br />
consider page views as a surrogate for marketplace demand,<br />
but then dampen their effect to reduce the likelihood of<br />
spurious inflation.<br />
3
Popular = Traffic. Like membership, traffic in a community—<br />
page views or eyes on content—is one of the most frequently<br />
cited metrics for community health. In deriving the Traffic<br />
health factor, we started with the standard page view metric,<br />
but then mitigated the effect of robot crawlers in order to<br />
diminish their impact.<br />
Responsiveness. The speed with which community members<br />
respond to each other’s posts is another key metric for<br />
determining community health. Participants in support<br />
communities, for example, are only willing to wait for<br />
answers for a limited amount of time. The same is true for<br />
engagement and other types of communities. If there is too<br />
much of a lag between posts and responses, conversations<br />
peter off and members start looking elsewhere.<br />
The traditional response time metric counts the number<br />
of minutes between the first post and the first reply. That<br />
first post might be anything—a question, a blog article, an<br />
idea, a status update. Because our analysis of communitymember<br />
behavior has revealed the importance of subsequent<br />
responses, we have enhanced the traditional response time<br />
metric to account for all of the responses in a topic.<br />
Interactive = Topic Interaction. Interaction between<br />
participants is one of the key reasons that online communities<br />
exist. The traditional metric for measuring interaction is<br />
thread depth3 , where threads are topics of discussion and<br />
their depth is the average number of posts they contain. This<br />
way of looking at interaction, however, does not consider the<br />
number of individuals who are participating. As a result, a<br />
topic with six posts by the same participant would have the<br />
same depth as one with six different contributors. Because<br />
our experience with online communities has led us to<br />
understand that the number of participants in an interaction<br />
is even more important than the number of posts, we have<br />
added the dimension of unique contributors to our calculation<br />
of Topic Interaction.<br />
share this whitepaper<br />
Liveliness. Although most people would be hard-pressed<br />
to define it, they recognize and respond to liveliness or buzz<br />
when they encounter it. Research has shown that participants<br />
are not only attracted to but are also motivated to return and<br />
contribute in communities that feel animated and vibrant. 4<br />
We find that liveliness can be best measured by tracking<br />
a critical threshold of posting activity that experience and<br />
analysis have shown us characterizes healthy communities. In<br />
calculating the Liveliness factor, we look not only at the number<br />
of posts but also at their distribution within the community. We<br />
have identified the critical threshold at between five and ten<br />
posts per day in each community segment. Segments include<br />
discussion boards, forums, blogs, idea exchanges, and so forth.<br />
Lopsided distributions indicate a need to balance out the hot<br />
and cold spots in the community.<br />
In addition to these key factors, a positive atmosphere, civil<br />
behavior, and a degree of trust among members is essential<br />
to the success of online communities. Abusive language<br />
and harassment have no place in any community—online or<br />
otherwise—particularly one sponsored by an enterprise.<br />
The opinions expressed by community members need not<br />
all be positive—in fact, one sign of a healthy community is<br />
the freedom members feel to express their opinions about<br />
a company or its products. More important to community<br />
health, however, is the way in which those opinions are<br />
expressed. In our experience and that of other community<br />
experts, healthy communities rely on moderators and active<br />
community members to maintain a positive atmosphere<br />
and keep the anti-social behavior at bay. 5 As a result, the<br />
<strong>Community</strong> <strong>Health</strong> <strong>Index</strong> is already normalized for moderator<br />
control of atmosphere.<br />
4
using community<br />
health factors to<br />
drive action<br />
Further examination of health factor data from scores<br />
of communities reveals strong correlations between two<br />
groups of factors. The first group consists of Members,<br />
Content, and Traffic, which are closely aligned to traditional<br />
registration, posting, and page view metrics. These factors<br />
are strongly affected by community size. We refer to them as<br />
diagnostic indicators because they reflect the current state<br />
of the community.<br />
Fluctuations in a community’s diagnostic factors typically<br />
correspond to specific events and serve as a record of their<br />
impact on the community. This correlation allows community<br />
managers to use diagnostic factors to gauge the effectiveness<br />
of tactics designed to boost registrations or page views, such<br />
as contests, participation incentives, or outreach campaigns.<br />
Activities such as these appear as inflection points in the<br />
community’s diagnostic health factors.<br />
The remaining group of factors—Responsiveness, Interaction,<br />
and Liveliness—are less susceptible to the effects of<br />
community size, more indicative of patterns of behavior<br />
within the community, and tend to be predictive indicators<br />
of community health. They are, in effect, an early warning<br />
system for aspects of community health that may require<br />
attention or intervention before their effects become<br />
apparent. Not only are the predictive factors interesting in and<br />
of themselves, but community managers can learn a great<br />
deal by looking at the interplay between predictive factors.<br />
6 1<br />
5 2<br />
4 A 3<br />
6 1<br />
5 2<br />
4 C 3<br />
1. Members - 2. Content - 3. Traffic - 4. Liveliness<br />
5. Interaction - 6. Responsiveness<br />
6 1<br />
share this whitepaper<br />
5 2<br />
4 B 3<br />
Take the case of a hypothetical software publisher based on<br />
communities that run on the <strong>Lithium</strong> platform. Concerned<br />
about the response rate in its support community, the<br />
company recruits staff experts to provide answers to<br />
members’ questions. Although the Responsiveness health<br />
factor improves significantly as a result of this infusion, the<br />
Interaction factor, which is based in part on the number<br />
of unique participants in a thread or topic, begins to drop.<br />
<strong>Community</strong> members’ questions are being answered, but<br />
the interactions between participants that give it the feel of a<br />
community fall off significantly, as does the Liveliness factor.<br />
Instead, community members begin to view their community<br />
as just another support channel. Armed with this information,<br />
community managers can take action: setting out to identify<br />
and encourage home-grown experts from within the<br />
community to replace the staff experts. Over time, this will<br />
lead to more participants, increased interaction levels, and<br />
ultimately to a renewed interest in the community.<br />
5
4<br />
3.2<br />
2.4<br />
1.6<br />
0.8<br />
0<br />
A B Interaction<br />
Liveliness<br />
C<br />
Company Staff<br />
Introduced<br />
Responsivieness<br />
Nov.05<br />
Dec.05<br />
Jan.06<br />
Feb.06<br />
Mar.06<br />
Apr.06<br />
Jun.06<br />
Jul.06<br />
Aug.06<br />
Sep.06<br />
Oct.06<br />
Nov.06<br />
Dec.06<br />
Feb.07<br />
Mar.07<br />
Apr.07<br />
May.07<br />
Jun.07<br />
Jul.07<br />
Sep.07<br />
Oct.07<br />
Nov.07<br />
Dec.07<br />
Jan.08<br />
Feb.08<br />
Mar.08<br />
May.08<br />
Jun.08<br />
In addition to monitoring the community as a whole,<br />
community managers can correlate community health<br />
factors with usage metrics for specific community features<br />
to reveal the effects of these features on the community.<br />
<strong>Lithium</strong> customers, for example, can see the effects of<br />
critical engagement features such as Tagging, Kudos, Chat,<br />
or Accepted Solutions. This enables community managers to<br />
determine which features have the most positive impact on<br />
community health and to implement features or make other<br />
changes that have predictable effects on community health.<br />
Superuser Incentive<br />
Program Initiated<br />
S1 Predictive <strong>Health</strong> Factors<br />
share this whitepaper<br />
6
using the community<br />
health index as a<br />
community standard<br />
As noted earlier, community health factors provide diagnostic<br />
and predictive information useful in measuring community<br />
health. Viewed either as a snapshot or mapped over time,<br />
these factors reveal a great deal about an online community.<br />
To account for factors such as community size, age, and<br />
volatility, we apply a series of smoothing and normalization<br />
algorithms to enable communities of all types to use a single<br />
formulation of the <strong>Community</strong> <strong>Health</strong> <strong>Index</strong>.<br />
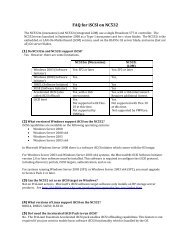
The three <strong>Community</strong> <strong>Health</strong> <strong>Index</strong> (CHI) compass diagrams<br />
below show healthy communities with the distinctly different<br />
profiles that are characteristic of support, engagement, and<br />
listening communities. Listening communities include both<br />
support and engagement elements. Although their profiles<br />
are different, all are healthy communities. These diagrams<br />
present a snapshot of health factors for a given period (in this<br />
case one week) as a relative percentage of the community’s<br />
highest scores. For the purposes of illustration, the Predictive<br />
and Diagnostic factors are normalized separately to make the<br />
different profiles easier to identify.<br />
The <strong>Community</strong> <strong>Health</strong> <strong>Index</strong> is on a scale of 0 to<br />
1000. The higher the number, the healthier the<br />
community and the more likely it will accomplish the<br />
goals of the members and the company. Regardless<br />
of a community’s score, there is always room for<br />
improvement and the individual health factors tell you<br />
exactly where to focus.<br />
6 1<br />
5 2<br />
4 S1 3<br />
6 1<br />
5 2<br />
4 L1 3<br />
1. Members - 2. Content - 3. Traffic - 4. Liveliness<br />
5. Interaction - 6. Responsiveness<br />
6 1<br />
share this whitepaper<br />
5 2<br />
4 E1 3<br />
In the sample support community (S1), the three predictive<br />
factors—Responsiveness, Interaction, and Liveliness—are<br />
balanced. In the sample, engagement (E1) and listening (L1)<br />
communities, Interaction and Liveliness are characteristically<br />
higher than Responsiveness.<br />
Simple CHI trend analysis, coupled with the ability to drill<br />
down to the individual health factors, provides an early<br />
warning of potentially serious problems within a community.<br />
It is important to note that a single health factor, like a single<br />
metric, doesn’t present the whole picture. Instead, community<br />
managers should consider the <strong>Community</strong> <strong>Health</strong> <strong>Index</strong> in<br />
conjunction with the individual health factors. As the graphs<br />
that follow show, a community can weather the decline in<br />
one or two health factors and remain healthy when the other<br />
factors are stable or improving.<br />
7
1800<br />
1440<br />
1080<br />
720<br />
360<br />
0<br />
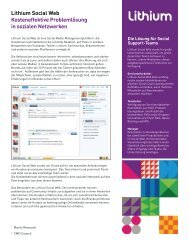
For example, the graphs below show diagnostic factors,<br />
predictive factors, and the health trend for a support<br />
community (S1).<br />
S1 Diagnostic <strong>Health</strong> Factors<br />
Members Content / 60 Traffic / 3000<br />
Nov.05<br />
Dec.05<br />
Jan.06<br />
Feb.06<br />
Mar.06<br />
Apr.06<br />
Jun.06<br />
Jul.06<br />
Aug.06<br />
Sep.06<br />
Oct.06<br />
Nov.06<br />
Dec.06<br />
Feb.07<br />
Mar.07<br />
Apr.07<br />
May.07<br />
Jun.07<br />
Jul.07<br />
Sep.07<br />
Oct.07<br />
Nov.07<br />
Dec.07<br />
Jan.08<br />
Feb.08<br />
Mar.08<br />
May.08<br />
Jun.08<br />
3.5<br />
2.8<br />
2.1<br />
1.4<br />
0.7<br />
0<br />
S1 Predictive <strong>Health</strong> Factors<br />
share this whitepaper<br />
Interaction Liveliness Responsiveness<br />
Nov.05<br />
Dec.05<br />
Jan.06<br />
Feb.06<br />
Mar.06<br />
Apr.06<br />
Jun.06<br />
Jul.06<br />
Aug.06<br />
Sep.06<br />
Oct.06<br />
Nov.06<br />
Dec.06<br />
Feb.07<br />
Mar.07<br />
Apr.07<br />
May.07<br />
Jun.07<br />
Jul.07<br />
Sep.07<br />
Oct.07<br />
Nov.07<br />
Dec.07<br />
Jan.08<br />
Feb.08<br />
Mar.08<br />
May.08<br />
Jun.08<br />
8
1.5<br />
1.2<br />
0.9<br />
0.6<br />
0.3<br />
0<br />
CHI = 797<br />
Our research has shown that support communities typically<br />
average between 1 and 4 interactions per topic. This<br />
community demonstrates a steady average Interaction of<br />
2, which is considered healthy. Likewise, a Responsiveness<br />
of greater than 1, which reflects the community’s ability to<br />
meet the expectations of most participants, is also healthy. A<br />
further indication of health is a Liveliness factor that shows<br />
improvement over time. Although the community’s diagnostic<br />
factors reveal evidence of a plateau at the end of its second<br />
year, its high content usefulness indicates that community<br />
members continue to derive benefit from the content. Overall,<br />
as its CHI indicates, this is a healthy community.<br />
S1 <strong>Community</strong><br />
<strong>Health</strong> Function <strong>Health</strong> Trend<br />
share this whitepaper<br />
Nov.05<br />
Dec.05<br />
Jan.06<br />
Feb.06<br />
Mar.06<br />
Apr.06<br />
Jun.06<br />
Jul.06<br />
Aug.06<br />
Sep.06<br />
Oct.06<br />
Nov.06<br />
Dec.06<br />
Feb.07<br />
Mar.07<br />
Apr.07<br />
May.07<br />
Jun.07<br />
Jul.07<br />
Sep.07<br />
Oct.07<br />
Nov.07<br />
Dec.07<br />
Jan.08<br />
Feb.08<br />
Mar.08<br />
May.08<br />
Jun.08<br />
Graphs of the Diagnostic factors, Predictive factors, and the<br />
<strong>Health</strong> Trend for a health support community. To plot the<br />
Diagnostic factors in a single plot, we have down-scaled<br />
Content by 60 and Traffic by 3000.<br />
9
10000<br />
8000<br />
6000<br />
4000<br />
2000<br />
0<br />
Dec.03<br />
Feb.04<br />
Apr.04<br />
Jun.04<br />
Aug.04<br />
Oct.04<br />
Nov.04<br />
Jan.05<br />
Mar.05<br />
May.05<br />
Jul.05<br />
Sep.05<br />
Oct.05<br />
Dec.05<br />
Feb.06<br />
Apr.06<br />
Jun.06<br />
Aug.06<br />
Oct.06<br />
Nov.06<br />
Jan.07<br />
Mar.07<br />
May.07<br />
Jul.07<br />
Sep.07<br />
Oct.07<br />
Dec.07<br />
Feb.08<br />
Apr.08<br />
Jun.08<br />
Aug.08<br />
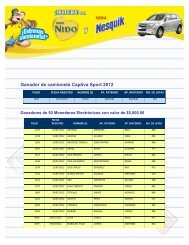
Graphs of the Diagnostic<br />
factors, Predictive factors,<br />
and the <strong>Health</strong> Trend for a<br />
health support community.<br />
To plot the Diagnostic<br />
factors in a single plot, we<br />
have down-scaled Content<br />
by 40 and Traffic by 650.<br />
S2 Diagnostic <strong>Health</strong> Factors<br />
1.5<br />
1.2<br />
0.9<br />
0.6<br />
0.3<br />
0<br />
Members Content / 40 Traffic / 650<br />
CHI = 208<br />
The graphs above show health factors for an older and larger but less robust community. This community is more than<br />
3.5<br />
2.8<br />
2.1<br />
1.4<br />
0.7<br />
S2 <strong>Community</strong><br />
share this whitepaper<br />
10 times the size of S1, but its diagnostic factors demonstrate wildly fluctuating yearly cycles with little actual improvement over<br />
time. The diagnostic factors show that the community experienced a spike in registrations toward the end of 2006, but was unable<br />
to capitalize on the infusion of new members. Responsiveness and Interaction are stable and within norms for support<br />
communities, but S2 shows a troubling decline in its Liveliness factor, which can often be remedied by adjusting the community’s<br />
structure, something that other large communities routinely do on an ongoing basis. Although still large, this community is<br />
stagnant, with a low CHI for its size.<br />
0<br />
S2 Predictive <strong>Health</strong> Factors<br />
Interaction Liveliness Responsiveness<br />
Dec.03<br />
Feb.04<br />
May.04<br />
Jul.04<br />
Sep.04<br />
Nov.04<br />
Jan.05<br />
Mar.05<br />
May.05<br />
Jul.05<br />
Sep.05<br />
Nov.05<br />
Jan.06<br />
Mar.06<br />
May.06<br />
Jul.06<br />
Oct.06<br />
Dec.06<br />
Feb.07<br />
Apr.07<br />
Jun.07<br />
Aug.07<br />
Oct.07<br />
Dec.07<br />
Feb.08<br />
Apr.08<br />
Jun.08<br />
Aug.08<br />
<strong>Health</strong> Function <strong>Health</strong> Trend<br />
Jan.04<br />
Feb.04<br />
Apr.04<br />
Jun.04<br />
Jul.04<br />
Sep.04<br />
Oct.04<br />
Dec.04<br />
Feb.05<br />
Mar.05<br />
May.05<br />
Jul.05<br />
Aug.05<br />
Oct.05<br />
Nov.05<br />
Jan.06<br />
Mar.06<br />
Apr.06<br />
Jun.06<br />
Jul.06<br />
Sep.06<br />
Nov.06<br />
Dec.06<br />
Feb.07<br />
Apr.07<br />
May.07<br />
Jul.07<br />
Aug.07<br />
Oct.07<br />
Dec.07<br />
Jan.08<br />
Mar.08<br />
Apr.08<br />
Jun.08<br />
Aug.08<br />
10
conclusion<br />
Although existing community metrics yield a tremendous<br />
amount of data, the industry has been unable until now to<br />
use that data to achieve a meaningful measure of community<br />
health. With the introduction of the <strong>Community</strong> <strong>Health</strong> <strong>Index</strong>,<br />
companies and community experts have a way to organize<br />
and compare this data against both the past performance of<br />
the community itself and against other similar communities.<br />
resources<br />
1 Butler, B. S. (2001). Membership Size, Communication Activity, and<br />
Sustainability: A Resource-Based Model of Online Social Structures.<br />
INFORMATION SYSTEMS RESEARCH, 12(4), 346-362.<br />
2Soroka,V., & Rafaeli,S (2006). Invisible Participants: How Cultural Capital Relates<br />
to Lurking Behavior. Proceedings of the 15th international conference on World<br />
Wide Web (pp163-172).<br />
3Preece, J. (2001). Sociability and usability in online communities: determining<br />
and measuring success. Behaviour and Information Technology, 347-356<br />
lithium.com | © 2012 <strong>Lithium</strong> Technologies, Inc. All Rights Reserved<br />
share this whitepaper<br />
In fact, we see communities using the <strong>Community</strong> <strong>Health</strong><br />
<strong>Index</strong> in multiple ways: as a metric to objectively measure the<br />
health of a community, as a means to validate the perceptions<br />
of community moderators and other community experts, and<br />
as diagnostic and prescriptive drivers to help communities<br />
meet ROI and business objectives.<br />
Companies have the data, and now they have a standard to<br />
compare it against.<br />
4 Ackerman, M. S., & Starr, B. (1995). Social activity indicators: interface<br />
components for CSCW systems. In Proceedings of the 8th annual ACM<br />
symposium on User interface and software technology (pp. 159-168).<br />
5Cosley, D., Frankowski, D., Kiesler, S., Terveen, L., & Riedl, J. (2005). How<br />
oversight improves member-maintained communities. In Proceedings of<br />
the SIGCHI conference on Human factors in computing systems (pp. 11-20).<br />
Portland, Oregon, USA: ACM<br />
<strong>Lithium</strong> social solutions helps the world’s most iconic brands to build brand nations—vibrant online communities of passionate social customers.<br />
<strong>Lithium</strong> helps top brands such as AT&T, Sephora, Univision, and PayPal build active online communities that turn customer passion into social<br />
media marketing ROI. For more information on how to create lasting competitive advantage with the social customer experience,<br />
visit lithium.com, or connect with us on Twitter, Facebook and our own brand nation – the Lithosphere.<br />
11
defining the CHI<br />
health factors<br />
Our goal in introducing the <strong>Community</strong> <strong>Health</strong> <strong>Index</strong> (CHI)<br />
is to provide a standard of measurement that all online<br />
communities can use. To that end, this section describes the<br />
representation of the six health factors as well as a formula<br />
for combining them.<br />
Members<br />
The standard measure for Members is the registration<br />
metric that all communities track. In the formulas that follow,<br />
Members is represented by μ.<br />
Content<br />
The two standard metrics that contribute to calculating content<br />
utility are posts and page views. Posts (represented by
Unlike page views and registrations, which are purely<br />
numeric,
Combining <strong>Health</strong> Factors<br />
After defining the health factors, the next step is to derive<br />
the functional form of the health function,
computing the<br />
community health<br />
index<br />
Although equation (6) defines the health function (
data series because it does not use that data efficiently. We<br />
developed a hybrid approach that takes advantage of both<br />
types of smoothing algorithms by using a weighted average<br />
between the two algorithms. The latest data near the end of<br />
the series are smoothed primarily with a weighted moving<br />
average. Earlier data are smoothed primarily with kernel<br />
smoothing that uses a Hanning window as its kernel function.<br />
The smoothed health function is called the health trend<br />
(denoted by without any subscript).<br />
Normalizing CHI for Comparisons<br />
The health trend will give a good indication of the community’s<br />
health throughout its history, so we can objectively compare<br />
the health condition of a community between any two points<br />
in time. However, the health trend is derived from the unnormalized<br />
health function, so we cannot directly compare<br />
the health between different communities. In applications,<br />
such as benchmark studies, that require comparison of health<br />
across communities, we must normalize the health function.<br />
There are many different ways to normalize the health function<br />
depending on what aspect of the communities we like to<br />
compare. For benchmark studies, we normalized the health<br />
function by the following steps:<br />
1. First we compute the smoothed derivative of<br />
the health function to reveal all the positive and<br />
negative health trends throughout the history of the<br />
community. (This operation is mathematically equivalent<br />
to taking the derivative of the health trend, because the<br />
smoothing operator commutes with the differential operator).<br />
2. We also weight the smoothed derivative with an exponential<br />
decay that has a decay time constant of 50 weeks. This<br />
will attenuate the effect of long past health trends on the<br />
community’s current health condition.<br />
share this whitepaper<br />
3. We compute the definite integral of the weighted derivative<br />
to obtain the “net health” of the community.<br />
4. We take into account the volatility of CHI by dividing the<br />
net health by the square root of the weighted mean absolute<br />
deviation of the health function’s derivative. The weighting<br />
function is the same as the one we used in step 2 of this<br />
normalization procedure.<br />
5. Because the weighted net health has a very large range<br />
of values, we apply the “signed-logarithm” function to the<br />
weighted net health so that its value is more linear. Here, the<br />
signed-logarithm is defined by<br />
6. Finally, to calibrate the result into a more commonly used<br />
scale, we shift the reference point by adding a constant