

YASKAWA ELECTRIC CORPORATION Annual Report 1999
YASKAWA ELECTRIC CORPORATION Annual Report 1999
YASKAWA ELECTRIC CORPORATION Annual Report 1999

Create successful ePaper yourself
Turn your PDF publications into a flip-book with our unique Google optimized e-Paper software.
Financial Review<br />
Business Results<br />
In the fiscal year ended March 20, <strong>1999</strong>, Yaskawa recorded a<br />
15.3% decrease in consolidated net sales, to ¥227.4 billion. By<br />
product group, sales in Mechatronics Components fell 20.3%,<br />
to ¥99.4 billion, accounting for 43.7% of net sales. This fall<br />
reflected a decrease in sales of AC servos as well as inverters<br />
in the domestic and overseas markets. Sales in Mechatronics<br />
Systems dropped 11.5%, to ¥40.5 billion, making up 17.8% of<br />
the Group’s net sales. This was due to weaker demand for<br />
supermechatronics products for use in semiconductor production<br />
equipment. Sales in Industrial Electric Components<br />
decreased 17.7%, to ¥35.6 billion, which accounted for 15.7%<br />
of net sales. The decline in this category was due to sluggish<br />
capital investment in domestic manufacturing industries and<br />
the effects of economic turmoil in Asia. In Industrial Electrical<br />
Control Systems, sales fell 8.9%, to ¥35.5 billion, or 15.6% of<br />
net sales. This decrease was the result of slumping capital<br />
investment in domestic manufacturing industries. Sales in<br />
others amounted to ¥16.2 billion, making up 7.2% of net sales.<br />
Cost of sales amounted to ¥166.0 billion and the cost of<br />
sales ratio was 73.0%, 1.4 percentage points higher than in the<br />
previous fiscal year. Selling, general & administrative (SG&A)<br />
expenses amounted to ¥60.8 billion. SG&A expenses as a percentage<br />
of net sales increased to 26.7%, from 23.4% in the<br />
previous fiscal year. Net operating income sank 95.5%, to ¥0.5<br />
billion. Ordinary income plunged 98.6%, to ¥0.1 billion. Net<br />
loss after taxes and minority interest was ¥3.8 billion, compared<br />
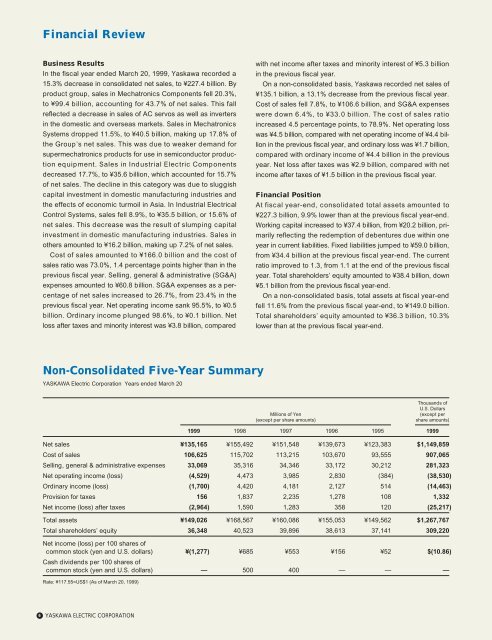
Non-Consolidated Five-Year Summary<br />
<strong>YASKAWA</strong> Electric Corporation Years ended March 20<br />
6 <strong>YASKAWA</strong> <strong>ELECTRIC</strong> <strong>CORPORATION</strong><br />
with net income after taxes and minority interest of ¥5.3 billion<br />
in the previous fiscal year.<br />
On a non-consolidated basis, Yaskawa recorded net sales of<br />
¥135.1 billion, a 13.1% decrease from the previous fiscal year.<br />
Cost of sales fell 7.8%, to ¥106.6 billion, and SG&A expenses<br />
were down 6.4%, to ¥33.0 billion. The cost of sales ratio<br />
increased 4.5 percentage points, to 78.9%. Net operating loss<br />
was ¥4.5 billion, compared with net operating income of ¥4.4 billion<br />
in the previous fiscal year, and ordinary loss was ¥1.7 billion,<br />
compared with ordinary income of ¥4.4 billion in the previous<br />
year. Net loss after taxes was ¥2.9 billion, compared with net<br />
income after taxes of ¥1.5 billion in the previous fiscal year.<br />
Financial Position<br />
At fiscal year-end, consolidated total assets amounted to<br />
¥227.3 billion, 9.9% lower than at the previous fiscal year-end.<br />
Working capital increased to ¥37.4 billion, from ¥20.2 billion, primarily<br />
reflecting the redemption of debentures due within one<br />
year in current liabilities. Fixed liabilities jumped to ¥59.0 billion,<br />
from ¥34.4 billion at the previous fiscal year-end. The current<br />
ratio improved to 1.3, from 1.1 at the end of the previous fiscal<br />
year. Total shareholders’ equity amounted to ¥38.4 billion, down<br />
¥5.1 billion from the previous fiscal year-end.<br />
On a non-consolidated basis, total assets at fiscal year-end<br />
fell 11.6% from the previous fiscal year-end, to ¥149.0 billion.<br />
Total shareholders’ equity amounted to ¥36.3 billion, 10.3%<br />
lower than at the previous fiscal year-end.<br />
Thousands of<br />
U.S. Dollars<br />
Millions of Yen (except per<br />
(except per share amounts) share amounts)<br />
<strong>1999</strong> 1998 1997 1996 1995 <strong>1999</strong><br />
Net sales ¥135,165 ¥155,492 ¥151,548 ¥139,673 ¥123,383 $1,149,859<br />
Cost of sales 106,625 115,702 113,215 103,670 93,555 907,065<br />
Selling, general & administrative expenses 33,069 35,316 34,346 33,172 30,212 281,323<br />
Net operating income (loss) (4,529) 4,473 3,985 2,830 (384) (38,530)<br />
Ordinary income (loss) (1,700) 4,420 4,181 2,127 514 (14,463)<br />
Provision for taxes 156 1,837 2,235 1,278 108 1,332<br />
Net income (loss) after taxes (2,964) 1,590 1,283 358 120 (25,217)<br />
Total assets ¥149,026 ¥168,567 ¥160,086 ¥155,053 ¥149,562 $1,267,767<br />
Total shareholders’ equity 36,348 40,523 39,896 38,613 37,141 309,220<br />
Net income (loss) per 100 shares of<br />
common stock (yen and U.S. dollars)<br />
Cash dividends per 100 shares of<br />
¥(1,277) ¥685 ¥553 ¥156 ¥52 $(10.86)<br />
common stock (yen and U.S. dollars) — 500 400 — — —<br />
Rate: ¥117.55=US$1 (As of March 20, <strong>1999</strong>)