Monitoring of Selected Heavy Metals Uptake by Plants and Soils in ...
Monitoring of Selected Heavy Metals Uptake by Plants and Soils in ...
Monitoring of Selected Heavy Metals Uptake by Plants and Soils in ...

You also want an ePaper? Increase the reach of your titles
YUMPU automatically turns print PDFs into web optimized ePapers that Google loves.
514<br />
The pH values <strong>of</strong> soils presented <strong>in</strong> Table 2 classified<br />
them as acidic. The pH <strong>of</strong> spr<strong>in</strong>g samples is <strong>of</strong>ten higher<br />
than the autumn samples. The amount <strong>of</strong> acid accumulated<br />
<strong>in</strong> soil can be expla<strong>in</strong>ed <strong>by</strong> the liberation <strong>of</strong> acids <strong>by</strong><br />
plant at the beg<strong>in</strong>n<strong>in</strong>g <strong>of</strong> the vegetation cycle <strong>and</strong> start<strong>in</strong>g<br />
soil-decomposition process.<br />
The concentration <strong>of</strong> analyzed metals shows some diversity<br />
<strong>in</strong> the studied area. The highest concentrations<br />
were observed for macroelements (Fe, Ca, Mg). These<br />
result from physicochemical properties <strong>of</strong> the <strong>in</strong>vestigated<br />
soils. In case <strong>of</strong> trace heavy metals, the highest<br />
difference between the m<strong>in</strong>imum <strong>and</strong> maximum value<br />
noticed was for Zn (119 mg/kg dry mass <strong>in</strong> autumn<br />
samples <strong>and</strong> 33 mg/kg <strong>in</strong> spr<strong>in</strong>g sample). The small difference<br />
for the spr<strong>in</strong>g samples can be expla<strong>in</strong>ed <strong>by</strong> an<br />
<strong>in</strong>tensive cumulat<strong>in</strong>g <strong>of</strong> the elements <strong>by</strong> biota. The decrease<br />
<strong>in</strong> heavy metals concentration <strong>in</strong> soil samples from<br />
spr<strong>in</strong>g samples was observed.<br />
The concentration <strong>of</strong> heavy metals <strong>in</strong> the exam<strong>in</strong>ed<br />
soils did not exceed the limited values for agricultural<br />
soils (accord<strong>in</strong>g to Polish Norms) [20].<br />
The applied acidic extraction allows for the determ<strong>in</strong>ation<br />
<strong>of</strong> total metal concentrations <strong>in</strong> soil. The values <strong>of</strong><br />
total concentration <strong>of</strong> heavy metals were related to its<br />
uptake <strong>by</strong> plants [16].<br />
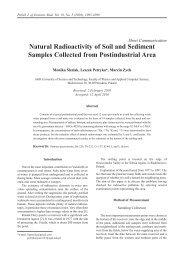
The metal concentrations <strong>in</strong> biosensors, i.e. grasses,<br />
mosses <strong>and</strong> p<strong>in</strong>e needles, similarly to soil, show differences<br />
(Table 4). The observed differences between m<strong>in</strong>imum<br />
<strong>and</strong> maximum values (for example: grasses Pb - 3,<br />
Cu - 35, Zn - 75, Fe - 499, Ca - 5615, Mg - 2315 mg/kg<br />
dry mass) are related to a different pollution level <strong>of</strong> the<br />
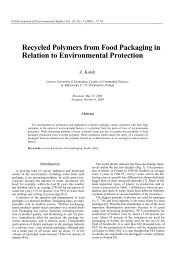
exam<strong>in</strong>ed places. The highest concentration <strong>of</strong> heavy<br />
metals were found <strong>in</strong> plants collected dur<strong>in</strong>g spr<strong>in</strong>gtime<br />
(Fig. 2) <strong>and</strong> from the areas localised near high traffic<br />
streets, <strong>and</strong> residential <strong>and</strong> commercial area with a heavy<br />
use <strong>of</strong> heat<strong>in</strong>g appliances (Fig. 1).<br />
Generally, the concentrations <strong>of</strong> selected metals <strong>in</strong><br />
plants are <strong>in</strong> the range <strong>of</strong> values recommended <strong>by</strong> the<br />
Polish Norms [20]. Only <strong>in</strong> the case <strong>of</strong> lead does the<br />
mean concentration exceed the admissible st<strong>and</strong>ard<br />
(limited value - 10 mg/kg dry mass). Special attention<br />
should be given to a considerable accumulation <strong>of</strong> Pb <strong>in</strong><br />
grasses. The maximum detected concentration was four<br />
times higher than the permitted value. It is important to<br />
notice that this element negatively <strong>in</strong>fluences the physiological<br />
processes <strong>of</strong> plants.<br />
Analysis <strong>of</strong> metal uptake <strong>by</strong> plants serv<strong>in</strong>g as biosensors<br />
permits us evaluation <strong>of</strong> pollution <strong>in</strong> the studied<br />
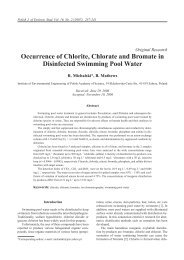
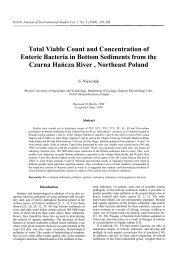
area. The concentration <strong>of</strong> metals <strong>in</strong> grasses was proportional<br />
to those <strong>in</strong> soil (Fig. 3). A variance analysis<br />
(Scheffe's test) was performed to evaluate correlations <strong>in</strong><br />
plant soil system us<strong>in</strong>g StatS<strong>of</strong>t Statistica 5.0 [21]. L<strong>in</strong>ear<br />
correlation coefficients show a dist<strong>in</strong>ct dependence<br />
between content <strong>of</strong> heavy metals <strong>in</strong> plants <strong>and</strong> soils<br />
(Table 4).<br />
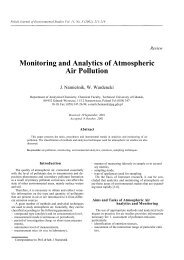
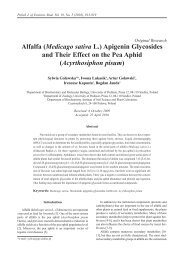
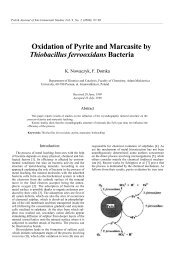
Correlation <strong>and</strong> regularities <strong>in</strong> the accumulation <strong>of</strong><br />
selected metals <strong>in</strong> biota (results from years 1995 - 1998)<br />
are presented (Fig. 4).<br />
It can be noticed that the metal contents <strong>in</strong> grasses<br />
were almost unchanged dur<strong>in</strong>g the study period. The<br />
mean concentrations <strong>of</strong> these elements were as follows:<br />
Pb - 25, Cu - 20, Zn - 83 mg/kg dry mass. The small<br />
differences <strong>of</strong> values can be caused <strong>by</strong> changes <strong>of</strong><br />
Table 4. L<strong>in</strong>ear correlation coefficients (R 2 ) for comparison <strong>of</strong><br />
the total content <strong>of</strong> heavy metals <strong>in</strong> plants <strong>and</strong> soils (n=31),<br />
p = 0.05<br />
Fig. 2. Concentration <strong>of</strong> heavy metals <strong>in</strong> grasses (number <strong>of</strong><br />
samples, n = 36) sampled <strong>in</strong> autumn <strong>and</strong> spr<strong>in</strong>g.<br />
Fig. 3. Comparison <strong>of</strong> Pb concentration <strong>in</strong> soil <strong>and</strong> <strong>in</strong> grass<br />
samples collected <strong>in</strong> Torun (p=0.02), R 2 = 0.9520.<br />
Buszewski B.et al.<br />
Fig. 4. Comparison <strong>of</strong> the content <strong>of</strong> heavy metals <strong>in</strong> grasses <strong>in</strong><br />
1995-1998.