r. david mclean, jeffrey pontiff and akiko watanabe - Center for ...
r. david mclean, jeffrey pontiff and akiko watanabe - Center for ...
r. david mclean, jeffrey pontiff and akiko watanabe - Center for ...

Create successful ePaper yourself
Turn your PDF publications into a flip-book with our unique Google optimized e-Paper software.
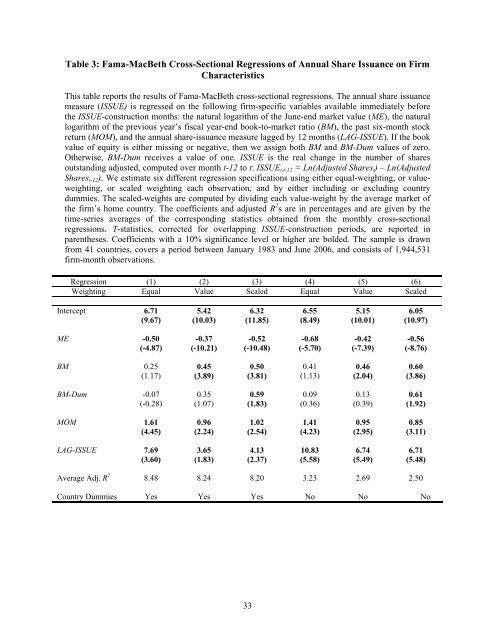
Table 3: Fama-MacBeth Cross-Sectional Regressions of Annual Share Issuance on Firm<br />
Characteristics<br />
This table reports the results of Fama-MacBeth cross-sectional regressions. The annual share issuance<br />
measure (ISSUE) is regressed on the following firm-specific variables available immediately be<strong>for</strong>e<br />
the ISSUE-construction months: the natural logarithm of the June-end market value (ME), the natural<br />
logarithm of the previous year’s fiscal year-end book-to-market ratio (BM), the past six-month stock<br />
return (MOM), <strong>and</strong> the annual share-issuance measure lagged by 12 months (LAG-ISSUE). If the book<br />
value of equity is either missing or negative, then we assign both BM <strong>and</strong> BM-Dum values of zero.<br />
Otherwise, BM-Dum receives a value of one. ISSUE is the real change in the number of shares<br />
outst<strong>and</strong>ing adjusted, computed over month t-12 to t: ISSUEt,t-12 = Ln(Adjusted Sharest) – Ln(Adjusted<br />
Sharest-12). We estimate six different regression specifications using either equal-weighting, or valueweighting,<br />
or scaled weighting each observation, <strong>and</strong> by either including or excluding country<br />
dummies. The scaled-weights are computed by dividing each value-weight by the average market of<br />
the firm’s home country. The coefficients <strong>and</strong> adjusted R 2 s are in percentages <strong>and</strong> are given by the<br />
time-series averages of the corresponding statistics obtained from the monthly cross-sectional<br />
regressions. T-statistics, corrected <strong>for</strong> overlapping ISSUE-construction periods, are reported in<br />
parentheses. Coefficients with a 10% significance level or higher are bolded. The sample is drawn<br />
from 41 countries, covers a period between January 1983 <strong>and</strong> June 2006, <strong>and</strong> consists of 1,944,531<br />
firm-month observations.<br />
Regression (1) (2) (3) (4) (5) (6)<br />
Weighting Equal Value Scaled Equal Value Scaled<br />
Intercept 6.71 5.42 6.32 6.55 5.15 6.05<br />
(9.67) (10.03) (11.85) (8.49) (10.01) (10.97)<br />
ME -0.50 -0.37 -0.52 -0.68 -0.42 -0.56<br />
(-4.87) (-10.21) (-10.48) (-5.70) (-7.39) (-8.76)<br />
BM 0.25 0.45 0.50 0.41 0.46 0.60<br />
(1.17) (3.89) (3.81) (1.13) (2.04) (3.86)<br />
BM-Dum -0.07 0.35 0.59 0.09 0.13 0.61<br />
(-0.28) (1.07) (1.83) (0.36) (0.39) (1.92)<br />
MOM 1.61 0.96 1.02 1.41 0.95 0.85<br />
(4.45) (2.24) (2.54) (4.23) (2.95) (3.11)<br />
LAG-ISSUE 7.69 3.65 4.13 10.83 6.74 6.71<br />
(3.60) (1.83) (2.37) (5.58) (5.49) (5.48)<br />
Average Adj. R 2 8.48 8.24 8.20 3.23 2.69 2.50<br />
Country Dummies Yes Yes Yes No No No<br />
33