October 2010 Barry Krisberg, Ph.D. Linh Vuong Christopher Hartney ...
October 2010 Barry Krisberg, Ph.D. Linh Vuong Christopher Hartney ...
October 2010 Barry Krisberg, Ph.D. Linh Vuong Christopher Hartney ...

You also want an ePaper? Increase the reach of your titles
YUMPU automatically turns print PDFs into web optimized ePapers that Google loves.
A New Era in California Juvenile Justice<br />
IMPACT ON PUBLIC SAFETY<br />
Reported Crime<br />
Prior to 1996, California’s rate of reported violent crime was rising while the property crime rate was falling.<br />
From 1996 to 2009, both violent and property crime rates steadily declined to their 25-year lows of 454 per<br />
100,000 for violent crimes and 1,548 per 100,000 for property crimes in 2009. 5 The dramatic decline in the<br />
CYA population was not associated with an increase in crimes reported to the police.<br />
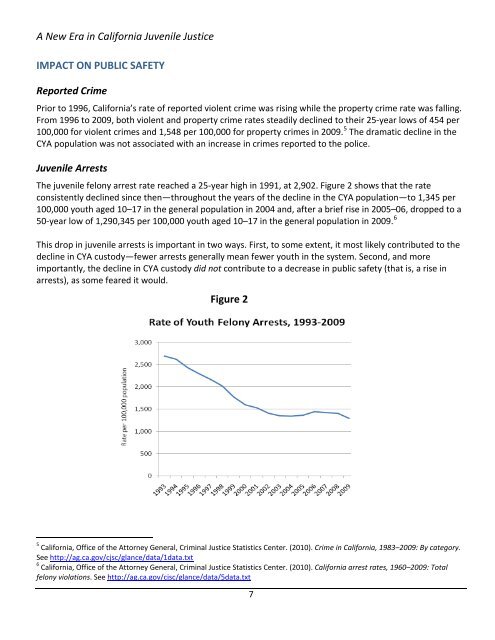
Juvenile Arrests<br />
The juvenile felony arrest rate reached a 25-year high in 1991, at 2,902. Figure 2 shows that the rate<br />
consistently declined since then—throughout the years of the decline in the CYA population—to 1,345 per<br />
100,000 youth aged 10–17 in the general population in 2004 and, after a brief rise in 2005–06, dropped to a<br />
50-year low of 1,290,345 per 100,000 youth aged 10–17 in the general population in 2009. 6<br />
This drop in juvenile arrests is important in two ways. First, to some extent, it most likely contributed to the<br />
decline in CYA custody—fewer arrests generally mean fewer youth in the system. Second, and more<br />
importantly, the decline in CYA custody did not contribute to a decrease in public safety (that is, a rise in<br />
arrests), as some feared it would.<br />
Figure 2<br />
5<br />
California, Office of the Attorney General, Criminal Justice Statistics Center. (<strong>2010</strong>). Crime in California, 1983–2009: By category.<br />
See http://ag.ca.gov/cjsc/glance/data/1data.txt<br />
6<br />
California, Office of the Attorney General, Criminal Justice Statistics Center. (<strong>2010</strong>). California arrest rates, 1960–2009: Total<br />
felony violations. See http://ag.ca.gov/cjsc/glance/data/5data.txt<br />
7