Comparison of the Phenolic Content and Total Antioxidant Activity in ...
Comparison of the Phenolic Content and Total Antioxidant Activity in ...
Comparison of the Phenolic Content and Total Antioxidant Activity in ...

Create successful ePaper yourself
Turn your PDF publications into a flip-book with our unique Google optimized e-Paper software.
Czech J. Food Sci. Vol. 26, No. 4: 242–253<br />
5.0<br />
(mmol/l)<br />
4.5<br />
4.0<br />
3.5<br />
3.0<br />
2.5<br />
2.0<br />
1.5<br />
1.0<br />
0.5<br />
0.0<br />
PCM PBM TEAC/2 FRAP DPPH<br />
1 2 3 4 5 6 7 8<br />
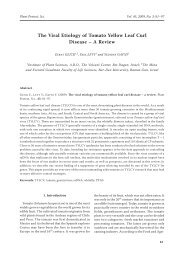
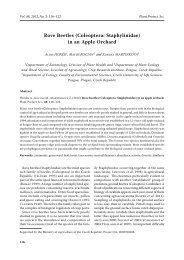
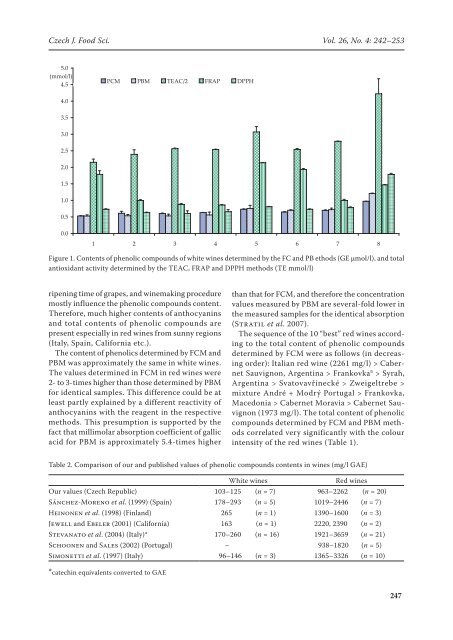
Figure 1. <strong>Content</strong>s <strong>of</strong> phenolic compounds <strong>of</strong> white w<strong>in</strong>es determ<strong>in</strong>ed by <strong>the</strong> FC <strong>and</strong> PB ethods (GE μmol/l), <strong>and</strong> total<br />
antioxidant activity determ<strong>in</strong>ed by <strong>the</strong> TEAC, FRAP <strong>and</strong> DPPH methods (TE mmol/l)<br />
ripen<strong>in</strong>g time <strong>of</strong> grapes, <strong>and</strong> w<strong>in</strong>emak<strong>in</strong>g procedure<br />
mostly <strong>in</strong>fluence <strong>the</strong> phenolic compounds content.<br />
Therefore, much higher contents <strong>of</strong> anthocyan<strong>in</strong>s<br />
<strong>and</strong> total contents <strong>of</strong> phenolic compounds are<br />
present especially <strong>in</strong> red w<strong>in</strong>es from sunny regions<br />
(Italy, Spa<strong>in</strong>, California etc.).<br />
The content <strong>of</strong> phenolics determ<strong>in</strong>ed by FCM <strong>and</strong><br />
PBM was approximately <strong>the</strong> same <strong>in</strong> white w<strong>in</strong>es.<br />
The values determ<strong>in</strong>ed <strong>in</strong> FCM <strong>in</strong> red w<strong>in</strong>es were<br />
2- to 3-times higher than those determ<strong>in</strong>ed by PBM<br />
for identical samples. This difference could be at<br />
least partly expla<strong>in</strong>ed by a different reactivity <strong>of</strong><br />
anthocyan<strong>in</strong>s with <strong>the</strong> reagent <strong>in</strong> <strong>the</strong> respective<br />
methods. This presumption is supported by <strong>the</strong><br />
fact that millimolar absorption coefficient <strong>of</strong> gallic<br />
acid for PBM is approximately 5.4-times higher<br />
than that for FCM, <strong>and</strong> <strong>the</strong>refore <strong>the</strong> concentration<br />
values measured by PBM are several-fold lower <strong>in</strong><br />
<strong>the</strong> measured samples for <strong>the</strong> identical absorption<br />
(Stratil et al. 2007).<br />
The sequence <strong>of</strong> <strong>the</strong> 10 “best” red w<strong>in</strong>es accord<strong>in</strong>g<br />
to <strong>the</strong> total content <strong>of</strong> phenolic compounds<br />
determ<strong>in</strong>ed by FCM were as follows (<strong>in</strong> decreas<strong>in</strong>g<br />
order): Italian red w<strong>in</strong>e (2261 mg/l) > Cabernet<br />
Sauvignon, Argent<strong>in</strong>a > Frankovka a > Syrah,<br />
Argent<strong>in</strong>a > Svatovavř<strong>in</strong>ecké > Zweigeltrebe ><br />
mixture André + Modrý Portugal > Frankovka,<br />
Macedonia > Cabernet Moravia > Cabernet Sauvignon<br />
(1973 mg/l). The total content <strong>of</strong> phenolic<br />
compounds determ<strong>in</strong>ed by FCM <strong>and</strong> PBM methods<br />
correlated very significantly with <strong>the</strong> colour<br />
<strong>in</strong>tensity <strong>of</strong> <strong>the</strong> red w<strong>in</strong>es (Table 1).<br />
Table 2. <strong>Comparison</strong> <strong>of</strong> our <strong>and</strong> published values <strong>of</strong> phenolic compounds contents <strong>in</strong> w<strong>in</strong>es (mg/l GAE)<br />
White w<strong>in</strong>es Red w<strong>in</strong>es<br />
Our values (Czech Republic) 103–125 (n = 7) 963–2262 (n = 20)<br />
Sánchez-Moreno et al. (1999) (Spa<strong>in</strong>) 178–293 (n = 5) 1019–2446 (n = 7)<br />
He<strong>in</strong>onen et al. (1998) (F<strong>in</strong>l<strong>and</strong>) 265 (n = 1) 1390–1600 (n = 3)<br />
Jewell <strong>and</strong> Ebeler (2001) (California) 163 (n = 1) 2220, 2390 (n = 2)<br />
Stevanato et al. (2004) (Italy)* 170–260 (n = 16) 1921–3659 (n = 21)<br />
Schoonen <strong>and</strong> Sales (2002) (Portugal) – 938–1820 (n = 5)<br />
Simonetti et al. (1997) (Italy) 96–146 (n = 3) 1365–3326 (n = 10)<br />
*catech<strong>in</strong> equivalents converted to GAE<br />
247