Actor Network Theory - Leicester Research Archive - University of ...
Actor Network Theory - Leicester Research Archive - University of ...
Actor Network Theory - Leicester Research Archive - University of ...

Create successful ePaper yourself
Turn your PDF publications into a flip-book with our unique Google optimized e-Paper software.
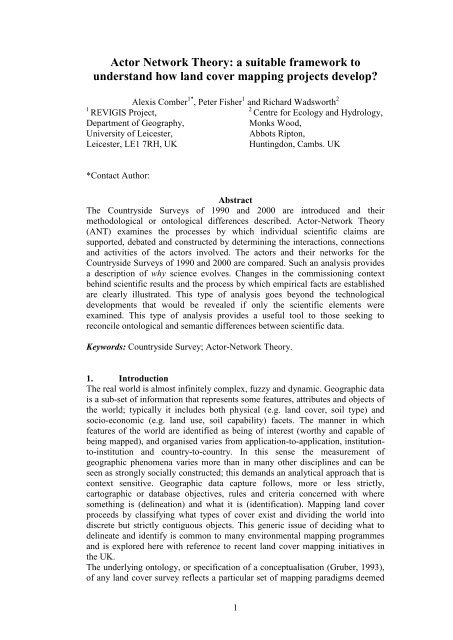
<strong>Actor</strong> <strong>Network</strong> <strong>Theory</strong>: a suitable framework to<br />
understand how land cover mapping projects develop?<br />
Alexis Comber 1* , Peter Fisher 1 and Richard Wadsworth 2<br />
1<br />
REVIGIS Project,<br />
2<br />
Centre for Ecology and Hydrology,<br />
Department <strong>of</strong> Geography,<br />
Monks Wood,<br />
<strong>University</strong> <strong>of</strong> <strong>Leicester</strong>,<br />
Abbots Ripton,<br />
<strong>Leicester</strong>, LE1 7RH, UK<br />
Huntingdon, Cambs. UK<br />
*Contact Author:<br />
Abstract<br />
The Countryside Surveys <strong>of</strong> 1990 and 2000 are introduced and their<br />
methodological or ontological differences described. <strong>Actor</strong>-<strong>Network</strong> <strong>Theory</strong><br />
(ANT) examines the processes by which individual scientific claims are<br />
supported, debated and constructed by determining the interactions, connections<br />
and activities <strong>of</strong> the actors involved. The actors and their networks for the<br />
Countryside Surveys <strong>of</strong> 1990 and 2000 are compared. Such an analysis provides<br />
a description <strong>of</strong> why science evolves. Changes in the commissioning context<br />
behind scientific results and the process by which empirical facts are established<br />
are clearly illustrated. This type <strong>of</strong> analysis goes beyond the technological<br />
developments that would be revealed if only the scientific elements were<br />
examined. This type <strong>of</strong> analysis provides a useful tool to those seeking to<br />
reconcile ontological and semantic differences between scientific data.<br />
Keywords: Countryside Survey; <strong>Actor</strong>-<strong>Network</strong> <strong>Theory</strong>.<br />
1. Introduction<br />
The real world is almost infinitely complex, fuzzy and dynamic. Geographic data<br />
is a sub-set <strong>of</strong> information that represents some features, attributes and objects <strong>of</strong><br />
the world; typically it includes both physical (e.g. land cover, soil type) and<br />
socio-economic (e.g. land use, soil capability) facets. The manner in which<br />
features <strong>of</strong> the world are identified as being <strong>of</strong> interest (worthy and capable <strong>of</strong><br />
being mapped), and organised varies from application-to-application, institutionto-institution<br />
and country-to-country. In this sense the measurement <strong>of</strong><br />
geographic phenomena varies more than in many other disciplines and can be<br />
seen as strongly socially constructed; this demands an analytical approach that is<br />
context sensitive. Geographic data capture follows, more or less strictly,<br />
cartographic or database objectives, rules and criteria concerned with where<br />
something is (delineation) and what it is (identification). Mapping land cover<br />
proceeds by classifying what types <strong>of</strong> cover exist and dividing the world into<br />
discrete but strictly contiguous objects. This generic issue <strong>of</strong> deciding what to<br />
delineate and identify is common to many environmental mapping programmes<br />
and is explored here with reference to recent land cover mapping initiatives in<br />
the UK.<br />
The underlying ontology, or specification <strong>of</strong> a conceptualisation (Gruber, 1993),<br />
<strong>of</strong> any land cover survey reflects a particular set <strong>of</strong> mapping paradigms deemed<br />
1
to be suitable for the task in hand. The origins <strong>of</strong> this specification depend upon<br />
the scientific and cultural norms <strong>of</strong> the agency, institution or organisation<br />
responsible for the data. Every ontology defines which objects are identified, the<br />
intended meaning behind object labels or nomenclatures, and the characteristics<br />
<strong>of</strong> the database structures: timing, periodicity, scale and granularity <strong>of</strong> data<br />
recording and information reporting. For example, Harvey & Chrisman (1998)<br />
show how different agencies construct different notions <strong>of</strong> ―Wetlands‖ in order<br />
to manage different policy objectives for the same area, and Bowker (2000)<br />
showed the extent to which biodiversity data is deeply constructed by<br />
―historiographical issues‖ and institutional politics. More general effects <strong>of</strong><br />
institutional and cultural context upon geographic information have been<br />
considered with reference to Geographical Information Systems (GIS). Anderson<br />
(1996) proposes an approach to GIS evaluation that considers the transfer <strong>of</strong><br />
technology in the light <strong>of</strong> organisational context. Martin (1998) suggests that<br />
prominent issues in the development <strong>of</strong> GIS should be considered in their<br />
evaluation. Visser et al. (2001) argue for the development <strong>of</strong> ―semantic<br />
translators‖ to surmount the differences in ontology (conceptualisation) in<br />
geographic data. This body <strong>of</strong> work has shown that considering both the<br />
technical and the organisational components <strong>of</strong> geographic information enables a<br />
greater understanding <strong>of</strong> its suitability for other applications. Analysis <strong>of</strong> the<br />
interactions between these aspects will provide a greater understanding <strong>of</strong> how<br />
the land cover information was derived and what it means.<br />
The notions <strong>of</strong> interoperability and transferability <strong>of</strong> data are increasingly<br />
important (Bishr, 1998; Visser et al., 2001). Current approaches to the evaluation<br />
<strong>of</strong> land cover monitoring activities focus almost exclusively on technical aspects:<br />
the distribution and number <strong>of</strong> the sample, the extent <strong>of</strong> correspondence with a<br />
validation dataset, dataset consistency, and so on. They do not provide a<br />
framework within which it is possible to critique the glasses through which we<br />
view the world. We argue that technological developments on their own are not<br />
sufficient to be able to understand, evaluate and relate geographical data with<br />
different ontological pedigrees; such data have to be viewed in the context <strong>of</strong><br />
their conceptualisation and construction.<br />
<strong>Actor</strong>-network theory (ANT) is associated with the analyses <strong>of</strong> scientific and<br />
technological artifacts by Bruno Latour and Michel Callon in the late 1980s.<br />
Whilst Latour has never referred to his own work as ―<strong>Actor</strong>-<strong>Network</strong> <strong>Theory</strong>‖,<br />
the concepts were formalised into a theory by Callon and John Law. In studying<br />
science, technology and society (STS), Latour and Callon argue that scientific<br />
knowledge is local and constructed by a network <strong>of</strong> actors (Latour, 1987; Callon,<br />
1991). Rather than considering the results or representations produced by<br />
science, ANT seeks to identify the processes that produce the results.<br />
Specifically it tries to circumvent any need to choose between internalist and<br />
externalist explanations <strong>of</strong> results. Internalism sees scientific activity purely<br />
resulting from the structure <strong>of</strong> its own discipline, whilst externalism explains<br />
scientific activity in terms <strong>of</strong> the political and historical context. In ANT<br />
everything is strategic, negotiated and contingent—there is no ‗inside‘ or<br />
‗outside‘, simply networks and their connections. It has been <strong>of</strong> great interest to<br />
those involved in studying the creation <strong>of</strong> science, because it <strong>of</strong>fers the<br />
opportunity to view the activity <strong>of</strong> scientific investigation, not just in terms <strong>of</strong><br />
results and accuracy <strong>of</strong> result, but also process.<br />
1.1 Land cover mapping in the UK as a case study?<br />
2
The Countryside Survey <strong>of</strong> the United Kingdom is a monitoring programme that<br />
has quantified the extent <strong>of</strong> changes in the natural environment at irregular<br />
intervals since 1978 (Haines-Young et al., 2000). We are primarily concerned<br />
with the last two surveys (1990 and 2000) that report land cover through two<br />
components:<br />
- Field Survey <strong>of</strong> broad habitats and landscape features (FS1990, FS2000);<br />
- Land Cover Mapping from satellites (LCMGB and LCM2000)<br />
Acronyms for the different component datasets are given in Table 1.<br />
Table 1 A list <strong>of</strong> the acronyms used for different datasets<br />
Dataset Acronym Reference<br />
Satellite derived land cover map (generic) LCM N/A<br />
Field Survey (generic) FS N/A<br />
Land Cover Map <strong>of</strong> Great Britain (1990) LCMGB Fuller et al., 1994<br />
Field Survey component <strong>of</strong> CS1990 FS1990 Barr et al., 1993<br />
Land Cover Map 2000 LCM2000 Fuller et al., 2002<br />
Field Survey component <strong>of</strong> CS2000 FS2000 Haines-Young et al., 2000<br />
LCM2000 and FS2000 are parallel components to those <strong>of</strong> the previous<br />
Countryside Survey in 1990 (CS1990) (Barr et al., 1993), but to different degrees<br />
both have changed their methodology, in terms <strong>of</strong> both delineation and<br />
identification. Such ontological differences are a generic problem in many<br />
environmental inventories and can be described in terms <strong>of</strong> the interactions <strong>of</strong><br />
actors involved in commissioning, producing and using the data. Applying ANT<br />
to the Countryside Survey problem provides an illustrative explanation <strong>of</strong> the<br />
process by which the science and the products changed. We also show how such<br />
an analysis may be used to help:<br />
- Users seeking to reconcile ontological and semantic differences between<br />
CS1990 and CS2000 in order to better understand the data;<br />
- <strong>Research</strong>ers seeking to quantify and to provide formalisms to overcome<br />
these differences.<br />
This paper proceeds by outlining some <strong>of</strong> the issues involved in the field and<br />
satellite surveys <strong>of</strong> CS1990 and CS2000 (~2) a brief introduction to ANT (~3),<br />
the application <strong>of</strong> ANT to Countryside Survey (~4). The benefits <strong>of</strong> applying this<br />
analysis are discussed (~5), followed by some conclusions about the application<br />
<strong>of</strong> ANT (~6).<br />
2. Countryside Survey 1990 and 2000<br />
The Countryside Survey is a series <strong>of</strong> surveys primarily funded by Government<br />
through the DoE, (Department <strong>of</strong> the Environment) which then became DETR<br />
(Department <strong>of</strong> Environment Transport and the Regions), and is currently<br />
DEFRA (Department <strong>of</strong> Environment, Food and Rural Affairs). The first survey<br />
was in 1978 and was based on a stratified random sample <strong>of</strong> 256 1 kilometre<br />
squares (Bunce & Heal, 1984). The stratification divided Great Britain into 32<br />
land classes using a divisive multivariate statistical technique called TWINSPAN<br />
(Hill, 1979). Squares were selected at random from rural areas in each class and<br />
field surveyors recorded attributes <strong>of</strong> floristic and landscape features by<br />
annotating paper maps. This process was repeated in 1984 and 1990 and 1998. In<br />
1978 the emphasis <strong>of</strong> the survey was on recording ecological data, especially<br />
vegetation and soils. In 1984 the survey focussed on the mapping <strong>of</strong> land cover<br />
and landscape features. In 1990, all the features <strong>of</strong> the previous surveys were<br />
recorded including all plant species present (with the help <strong>of</strong> an aide-memoir <strong>of</strong><br />
200 key species) and phyto-sociological associations. In 1998 existing squares<br />
were mapped for land cover changes rather than independently. The number <strong>of</strong><br />
3
squares increased at each interval: 256 in 1978, 384 in 1984, 508 in 1990 and<br />
569 in 1998. In 1990 and in 1998 the field survey data was complemented by a<br />
national land cover survey derived from the classification <strong>of</strong> satellite data.<br />
2.1 Countryside Survey 1990<br />
CS1990 adopted a dual approach to land cover, complementing the detailed field<br />
survey <strong>of</strong> 508 1 km 2 sample squares (FS1990) with a national census produced<br />
from satellite data (LCMGB). The LCMGB was funded by the DoE and BNSC<br />
(the British National Space Centre) as a demonstration <strong>of</strong> the viability <strong>of</strong> satellite<br />
imagery. Both FS1990 and LCMGB were produced by CEH (the Centre for<br />
Ecology an Hydrology, then known as the Institute for Terrestrial Ecology, ITE).<br />
The surveys are described by Barr et al. (1993) and Fuller et al. (1994). The<br />
LCMGB was the first complete survey <strong>of</strong> the land cover <strong>of</strong> Great Britain to be<br />
mapped from satellite imagery. It was produced using a supervised maximum<br />
likelihood classification <strong>of</strong> Landsat Thematic Mapper data that had been resampled<br />
to a pixel size <strong>of</strong> 25 x 25 m. It records 25 ―Target‖ land cover types.<br />
By combining the field survey and land cover map data, CS1990 sought to<br />
complement the information <strong>of</strong> each <strong>of</strong> the two land cover initiatives. But<br />
FS1990 and LCMGB were not conceived, designed nor implemented together.<br />
Rather they had different ontologies in terms <strong>of</strong> the granularity <strong>of</strong> the information<br />
they captured and the knowledge they embodied. Consequently they provided<br />
different answers to questions about land cover and this created problems when<br />
their results were compared. For instance, the satellite-derived LCMGB recorded<br />
the area <strong>of</strong> the key cover type ―Open shrub heath / moor‖ as 8% <strong>of</strong> the country,<br />
while the field survey identified 5% (Fuller et al., 1998: Table 7, p.113). The<br />
different ontological pedigrees <strong>of</strong> the data are further illustrated by Wyatt et al.<br />
(1993) who note discrepancies due to ―differences in class definition and in the<br />
way the nomenclature was interpreted in the two surveys‖, and cite Bog as an<br />
example. In the 1990 field survey upland peat bog was defined from a botanical<br />
perspective, including wet ericaceous, predominantly heather moorland. LCMGB<br />
used a hydrological definition, which created a class <strong>of</strong> distinct spectral<br />
properties. Therefore the national extents <strong>of</strong> the two surveys differ greatly:<br />
16,600 km 2 (field survey), and 4300 km 2 (LCMGB) (Fuller et al., 1998).<br />
Despite the fact that the two surveys record fundamentally different things at<br />
different scales, with different nomenclatures, much <strong>of</strong> the work describing how<br />
the satellite data relate to the field survey data concentrated on describing the<br />
origins <strong>of</strong> difference between them (see for example, Wyatt et al., 1993; Cherrill<br />
et al., 1995; Fuller et al., 1998). The origins <strong>of</strong> difference were consistently<br />
identified as being:<br />
- timing (growth cycles, seasonal differences, diurnal effects);<br />
- spatial extent (the scale <strong>of</strong> data capture, geo-registration <strong>of</strong> satellite<br />
imagery, within-class heterogeneity, mixed pixels at boundaries);<br />
- statistical issues (non-random collection <strong>of</strong> training data, poor<br />
repeatability <strong>of</strong> field surveys);<br />
- issues <strong>of</strong> perception (choice <strong>of</strong> class labels, their definitions<br />
(nomenclature), methods <strong>of</strong> class recognition by surveyors, and the<br />
spectral separability <strong>of</strong> classes).<br />
Presenting FS1990 and LCMGB as part <strong>of</strong> a ―grand scheme‖, the focus was on<br />
the problems <strong>of</strong> integration rather than the opportunities presented by the<br />
different results. Each approach has its own advantages and disadvantages: the<br />
LCMGB can be used to provide national estimates / environmental audits as<br />
4
well as giving the broad context, and the FS1990 to provide highly detailed<br />
local estimates <strong>of</strong> land stock quality. Instead ontological differences were<br />
compounded by using the vector field-maps <strong>of</strong> the 1 km squares to provide the<br />
only estimate <strong>of</strong> the quality <strong>of</strong> LCMGB. The issue is not that the two surveys<br />
record different things but rather that the link between the two sets <strong>of</strong> features is<br />
inferred, and not rigorously defined.<br />
The Scoping Study reports for the next Countryside Survey (Haines-Young &<br />
Swanwick, 1996) recommended that the census <strong>of</strong> land cover using remotely<br />
sensed data be included as an integrated element <strong>of</strong> the CS2000 survey. The<br />
implication is that both projects were presented under the same ―umbrella‖ in<br />
CS1990 for pragmatism and convenience.<br />
2.2 The Countryside Survey 2000<br />
The Countryside Survey was repeated in 1998 and results were reported in<br />
2000/2001. Like CS1990 it includes two components recording land cover: a<br />
sample based field survey (FS2000) and a census land cover survey derived from<br />
satellite data, Land Cover Map 2000 (Fuller et al., 2002). A fundamental change<br />
from CS1990 was the requirement to report in terms <strong>of</strong> Broad Habitats. This was<br />
in order to meet UK policy obligations as a result <strong>of</strong> the UN Rio Declaration<br />
(Secretariat on the Convention on Biological Diversity, 2000) and the EU<br />
Habitats Directive (CEC, 1992). CS2000 was funded only after it demonstrated<br />
how its results would relate to the demands <strong>of</strong> these policies. ECOFACT (Bunce<br />
et al., 1999) formally established links between FS2000 and other field based<br />
approaches and classifications in the UK including: National Vegetation<br />
Classification (NVC), Phase I Habitat Survey and the Biodiversity Action Plan<br />
Broad Habitats. This work meant that FS2000 was able to speak the language <strong>of</strong><br />
policy in its reporting <strong>of</strong> land cover features. There was no parallel work for the<br />
land cover map.<br />
Due to the policy imperative CS2000 was required to use the Broad Habitats <strong>of</strong><br />
the Biodiversity Action Plan, to be defined by the Joint Nature Conservancy<br />
Council (JNCC). The JNCC, however, had little experience <strong>of</strong> the different<br />
conceptualisations <strong>of</strong> land cover features held by different organisations. Because<br />
the JNCC did not publish <strong>of</strong>ficial Broad Habitat definitions until July 2000<br />
(Jackson, 2000), the FS2000 and the LCM2000 teams had to apply working<br />
definitions. Furthermore, the Joint Nature Conservancy Council changed some <strong>of</strong><br />
the working definitions. According to some <strong>of</strong> the field surveyors this created<br />
some confusion: field surveyors had their own understanding <strong>of</strong> the terminology<br />
and had difficulties in recognising differences in meaning <strong>of</strong> the same<br />
terminology.<br />
2.3 Field Survey 2000<br />
The FS2000 differs from FS1990 in:<br />
- Extra squares to address issues raised by Scottish devolution;<br />
- Only mapping apparent changes in the existing squares;<br />
- Reporting changes in terms <strong>of</strong> Broad Habitats.<br />
The devolved Scottish Parliament required results that related to Scotland. Extra<br />
sampling was needed because sampling ignored political boundaries and related<br />
only to the observed environment. In the unenclosed upland areas there was a<br />
further change in the 1990 methodology: for FS2000 only changes at the Broad<br />
Habitat level were mapped. This was to avoid the problem <strong>of</strong> interpreter<br />
variation that happens when independent estimates <strong>of</strong> land cover features are<br />
compared. Much apparent ―change‖ can be the result <strong>of</strong> variation between<br />
5
different interpretations (Cherrill & McClean, 1999a, 1999b). Financial<br />
constraints may have been a factor in this aspect <strong>of</strong> the revised methodology<br />
―Time saved in this reduced mapping methodology will be put to establishing<br />
extra plots‖ (Barr, 2001: section 8.15).<br />
The recording only <strong>of</strong> change (and not the data primitives) assumes that the<br />
broad habitats will still be the currency <strong>of</strong> reporting land cover information for<br />
any future Countryside Survey, and provides a bias against reporting (what may<br />
be fatuous) change. This undermines the value <strong>of</strong> the field survey method that<br />
has recorded plant species and vegetation data consistently over time, allowing<br />
historical data to be re-analysed with respect to changed reporting frameworks<br />
(such as Broad Habitats in 2000).<br />
2.4 Land Cover Map 2000<br />
LCM2000 represents a significant methodological change from the past. It<br />
combines a parcel-based classification with some ancillary geographical data to<br />
provide greater classification accuracy and increased thematic detail. The major<br />
departures from LCMGB are:<br />
- Vector rather than raster format;<br />
- Per-parcel classification rather than per-pixel;<br />
- An expanded attribute table;<br />
- Changes in the reporting <strong>of</strong> land cover information.<br />
Image segmentation algorithms were used to identify homogenous areas within<br />
composite satellite images which were classified using a maximum likelihood<br />
algorithm. Various knowledge-based correction procedures were applied to the<br />
classified data to correct those that had been classified out <strong>of</strong> context or<br />
identified with low confidence. These corrections were recorded and included in<br />
the parcel attributes allowing the application <strong>of</strong> corrections to be traced.<br />
LCM2000 identifies 16 Target classes, subdivided in 26 Subclasses<br />
corresponding to Broad Habitats.<br />
The reasons for the change in methodology can be mainly attributed to three<br />
factors. Firstly, methodological advances such as parcel based approaches were<br />
developed through the CLEVER-Mapping project (Smith & Fuller, 2001).<br />
Secondly, increased policy pressures (in response to international agreements) as<br />
exercised by environmental agencies, that were now responsible for management<br />
<strong>of</strong> habitats. The third factor was pressure from the requirements <strong>of</strong> the user<br />
community, some <strong>of</strong> whom perceived the LCMGB to have low accuracy due to<br />
their poor understanding <strong>of</strong> remote sensing issues. This pressure was evident in<br />
environmental agency representation on the LCM2000 Steering Committee. This<br />
meant that the LCM2000 methodology and specification had to directly assist the<br />
environmental agencies in fulfilling their statutory obligations.<br />
3. <strong>Actor</strong>-<strong>Network</strong> <strong>Theory</strong><br />
ANT examines the processes by which individual scientific claims are supported,<br />
debated and constructed. By deconstructing and examining science, Latour<br />
(1987) observed that he <strong>of</strong>ten came across ―black boxes‖, that is, scientific<br />
theories, facts or equipment that are taken for granted and accepted as being true,<br />
accurate and useful by the scientific community. To fully understand science<br />
Latour believes that we should examine the processes by which hypotheses are<br />
generated, how support for them are gathered, and how through further efforts as<br />
well as scientific endeavour such hypotheses later become ―fact‖. Such facts in<br />
turn become the next layer <strong>of</strong> black boxes, or established truths. Latour uses a<br />
number <strong>of</strong> scientific stories or histories to illustrate how in the evolution towards<br />
6
a (now accepted) truth, there are various points at which the dissenting voice can<br />
intervene. A particular set <strong>of</strong> black boxes and paradigms exist, depending on<br />
where the point <strong>of</strong> entry is into the debate (Miettinen, 2001).<br />
Latour emphasised the importance <strong>of</strong> rhetoric in determining or stabilising<br />
(Miettinen, 2001) the outcome <strong>of</strong> a scientific debate. Proponents <strong>of</strong> a particular<br />
theory try to get as much support as they can. As science normally progresses by<br />
extending existing scientific theories, so at each stage towards the acceptance <strong>of</strong><br />
a hypothesis as a black box the support multiplies. The more black boxes and<br />
allies a theory has on its side, the harder it is to argue against: each objection will<br />
eventually come up against a black box that itself is almost impossible to argue<br />
against (given the support). The same network <strong>of</strong> allies and support also applies<br />
to laboratories and other research institutions<br />
ANT proposes that ideas and theories compete with each other. For a new theory<br />
to be successful, it needs to gain allies and evidence <strong>of</strong> its own. It also needs to<br />
try to convert the allies <strong>of</strong> competitor theories for its own use. If the proponents<br />
<strong>of</strong> a new theory fail to gather a large enough network <strong>of</strong> allies then, in the long<br />
run, it will be unsuccessful. In this way ANT sees the connections between allied<br />
actors (scientists, theories, black boxes) as a network. The relationships in actornetwork<br />
mechanisms create a supporting feedback loop: <strong>Theory</strong> A gains support<br />
from <strong>Theory</strong> B. At some point <strong>Theory</strong> A becomes successful, and this success in<br />
turn <strong>of</strong>fers further support to <strong>Theory</strong> B.<br />
Latour‘s actor-network model is not about how scientists make discoveries; it is<br />
about how the truth is constructed from the statements that scientists make. ANT,<br />
with its models <strong>of</strong> networks is useful when confronted with the increasingly<br />
cross-disciplinary nature <strong>of</strong> science. If one accepts the notion that once a theory<br />
has enough support to become a black box, (that is, accepted as the truth until<br />
another truth emerges), then this has strong implications for rationality,<br />
objectivity and the status <strong>of</strong> science. Many reject Latour's model on this basis.<br />
ANT's theoretical richness derives from its refusal to reduce explanations to just<br />
natural, social, or discursive categories while recognizing the significance <strong>of</strong><br />
each (Frohmann, 2001)<br />
Seeking to explain and explore the social construction <strong>of</strong> GIS some workers have<br />
turned to ANT. Martin (1998) examined GIS implementation by analysis <strong>of</strong> the<br />
social and technical interactions involved; Martin (2000) demonstrated the utility<br />
<strong>of</strong> ANT for providing explanations <strong>of</strong> why similar GIS implementations produce<br />
different outcomes. Another corpus <strong>of</strong> work has investigated the process <strong>of</strong><br />
negotiation over boundary objects. Understanding the dynamics <strong>of</strong> the<br />
negotiation process is a part <strong>of</strong> Latour‘s (1987) methodology <strong>of</strong> following<br />
scientists and tracing networks. These negotiations can lead to the adoption <strong>of</strong><br />
definitions or some stability in procedures for GIS implementation. Harvey<br />
(1997) and Harvey & Chrisman (1998) demonstrated the utility <strong>of</strong> boundary<br />
objects in assessing the relationships between GIS technology and peopleTheir<br />
approach involves more . han just the identification <strong>of</strong> boundary objects; it<br />
examines people‘s opinions and their relation to the boundary object in question,<br />
to ascertain differences in perceptions <strong>of</strong> the boundary object across social<br />
groups. Their examples, wetland classifications and technical standards, illustrate<br />
disagreement and localised utilisation <strong>of</strong> entity definitions or procedures that are<br />
meant to facilitate consistency across institutions and systems.<br />
3.1 Application <strong>of</strong> ANT<br />
7
The literature on ANT contains many concepts but their interpretation and<br />
application vary. Describing the concepts involved in ANT with the terms<br />
‗actor‘, ‗network‘ and ‗theory‘ is not straightforward. Martin (1998; 2000)<br />
provides a description <strong>of</strong> the concepts <strong>of</strong> ANT that focus on their potential use<br />
for the investigation <strong>of</strong> GIS actor-networks and the direction from which actornetwork<br />
analysis might approach geographic information. There are four aspects<br />
to applying ANT to a geographic domain: we need to identify: a) the actors, b)<br />
their networks, c) how ANT develops its analysis, and d) how ANT is applied.<br />
These are detailed in the following paragraphs.<br />
A network is <strong>of</strong>ten described in terms <strong>of</strong> nodes and links. In ANT the nodes are<br />
<strong>Actor</strong>s, and an <strong>Actor</strong> is any entity that interacts with other actors or serves as an<br />
intermediary between actors. ANT accepts humans and non-humans (objects) as<br />
actors, since all interactions between humans are mediated through objects <strong>of</strong> one<br />
type or another (Law, 1992). In ANT the links are the interactions between actors<br />
sometimes termed the ―translations‖ (Latour, 1987). The translation between<br />
humans and objects occurs when an object is designed or used. Latour refers to<br />
this as the ‗exchange <strong>of</strong> properties‘ between humans and non-humans.<br />
Interactions between actors are the primary building blocks <strong>of</strong> ANT but it has a<br />
number <strong>of</strong> more subtle relationships including: ―boundary objects‖, ―centres <strong>of</strong><br />
calculation‖ (analytical positions <strong>of</strong> greater understanding), ―inscription devices‖<br />
(that record and therefore translate), and ―obligatory point <strong>of</strong> passage‖ (a node<br />
that acts as an intermediary between networks) (Martin, 2000).<br />
3.2 The development <strong>of</strong> ANT<br />
The approach is to determine the interactions, connections and activities <strong>of</strong> actors<br />
involved. Even for small activities the possible number and dimension <strong>of</strong> all<br />
potential interactions (from strong to weak) <strong>of</strong> actors (human and non-human) at<br />
any particular point in time (as networks evolve) is very large.<br />
To help impose some constraints, Callon (1991) and Martin (2000) identified the<br />
main types <strong>of</strong> intermediaries in scientific networks. The application <strong>of</strong> ANT<br />
involves deciding on the point <strong>of</strong> entry into the analysis. One way is to examine<br />
what the texts, information, and job titles say about the way that the actors are<br />
linked to form a network. The ―<strong>of</strong>ficial‖ information in mission statements,<br />
reports, product information can then be combined with how individuals describe<br />
their role and the roles <strong>of</strong> others. The analyst seeking to understand the process<br />
by which a product has come into being, needs information from a number <strong>of</strong><br />
sources:<br />
- Texts: especially how network associations are strengthened through<br />
citations and references. (Texts also includes information in graphs,<br />
diagrams, memos, database records and progress reports).<br />
- Technical artefacts: especially how these align networks by dictating the<br />
resources required for an object to function. This may include the formal<br />
links between institutions and universities that legitimise activity giving<br />
strong academic associations.<br />
- Human beings: and the relationships derived from position, job,<br />
responsibility, and peer evaluation. This includes the control and power<br />
relationships that shape the nature <strong>of</strong> actor interactions and the key<br />
individuals in the process. Who is the champion <strong>of</strong> the project and how<br />
do they interact with others actors?<br />
8
- Money: gets translated into actions, who is commissioning and paying for<br />
the project, who is assessing the validity <strong>of</strong> the end-product and how do<br />
these actors relate?<br />
The links between actors have to be mapped in order to be able to elucidate the<br />
networks and structures. This can be done in many ways, but the key is to ensure<br />
that the dynamics <strong>of</strong> the actor-networks are adequately represented. Martin<br />
(2000) used two-dimensional network diagrams, placing the actors in one <strong>of</strong><br />
three categories: ―Input Resources‖, ―Accountable <strong>Actor</strong>s‖ and ―Recipients‖.<br />
Links between the actors were based on notions <strong>of</strong> ―Control‖, ―Skills / Abilities‖,<br />
―Money‖, and ―Information‖ to show the nature <strong>of</strong> their networks.<br />
4. Applying ANT to the Countryside Survey Land Cover Data<br />
The networks <strong>of</strong> the four land cover products were uncovered through an<br />
analysis <strong>of</strong> the published literature, internal reports, commissioning and scoping<br />
studies, and interim reports from the steering group. These were augmented by<br />
interviews with scientists, civil servants, agency representatives, current and<br />
future users. From this information ANT diagrams were produced using the<br />
structural framework developed by Martin (2000).<br />
4.1 ANT and LCMGB<br />
The actors and their linkages to LCMGB are shown in Figure 1. The uncluttered<br />
dynamics clearly show the initiative was a demonstration <strong>of</strong> what could be<br />
achieved with the latest technology. The DoE and BNSC commissioned and paid<br />
for the project, the raw data was in the form <strong>of</strong> satellite imagery, and the method<br />
was by existing per-pixel classification techniques drawing on the skills <strong>of</strong> the<br />
remote sensing community. These were brought together by the Earth<br />
Observation Section <strong>of</strong> CEH to produce the LCMGB. The impact <strong>of</strong> the field<br />
survey against which LCMGB was validated is clear: it exercised a degree <strong>of</strong><br />
control over the final product and contributed information about the extent to<br />
which the classes described by LCMGB related to other more botanically<br />
orientated classifications. It must be pointed out that this ―control‖ was only<br />
exercised post hoc.<br />
4.2 ANT and LCM2000<br />
The actors and their linkages in LCM2000 are shown in Figure 2. This exercise<br />
took place within a different context and with different actors to LCMGB. As a<br />
result the network and the nature <strong>of</strong> the influence between actors and over the<br />
project is different. The context within which actors formed networks changed<br />
and these differences can be seen in the way that LCM2000 was implemented.<br />
For example, instead <strong>of</strong> drawing on established methods, the EO Section at CEH<br />
entered into collaboration with a commercial organisation (Laserscan plc) to<br />
develop a completely new methodology for classifying satellite imagery. The<br />
LCM2000 speaks to a different audience than LCMGB. Compared to LCMGB, it<br />
was commissioned in a different way, applies a different methodology and<br />
reports different things. A key and new actor in the network is the Steering<br />
Group, primarily drawn from agencies and users <strong>of</strong> the LCMGB.<br />
4.3 ANT <strong>of</strong> FS1990<br />
The actors and their linkages for FS1990 are shown in Figure 3. The scenario for<br />
the FS1990 is uncluttered and the spheres <strong>of</strong> influence are very similar to those<br />
for LCMGB. The field survey had its origins firmly rooted in the development<br />
and expansion <strong>of</strong> previous surveys that had taken place in 1978 and in 1984. The<br />
―Previous Field Survey Methodology‖ therefore represents a stable influence on<br />
the whole process. It generates both skills for use in FS1990 as well as exercising<br />
9
some control. Similarly the Users contributing money to the 1990 exercise have<br />
little influence on the scientific method.<br />
4.4 ANT <strong>of</strong> FS2000<br />
The actors and their network for FS2000 are shown in Figure 4. The picture for<br />
FS2000 is much more complex than for FS1990. This is due to the increased<br />
number <strong>of</strong> actors exerting influence in many directions across the network. Of<br />
note are the impact <strong>of</strong> policy, the scoping study (Haines Young and Swanwick,<br />
2000), and the ECOFACT (Bunce et al., 1999) work, and the influence <strong>of</strong> users<br />
on methodology, and the more central role <strong>of</strong> the methodology. The previous<br />
field survey is much less <strong>of</strong> a direct actor than in 1990, reflecting the shift in<br />
emphasis towards the satisfying the demands <strong>of</strong> policy rather than ―science‖ per<br />
se.<br />
5. Discussion<br />
Before discussing the differences between the four networks two questions need<br />
to be asked: ―Are these networks informative?‖ and ―Are the networks<br />
defensible?‖ It is inevitable that the different actors will have different views as<br />
to how crucial their role was in the process and how the interactions between<br />
actors was manifested. It is also inevitable that not all actors and activities can be<br />
included (in fact beyond a certain level <strong>of</strong> complexity the diagrams cease to be<br />
interpretable and hence to supply information). We believe that these diagrams<br />
are informative and that they do encapsulate the issues around the<br />
commissioning and production <strong>of</strong> the land cover products. We also believe that<br />
the networks are defensible in that the actors and linkages that we portray can be<br />
deduced from the documentary evidence and links are limited to organisational<br />
control, money, skills and information: all factors that are relatively easy to<br />
identify.<br />
The value <strong>of</strong> ANT is that it now allows us to compare CS1990 and CS2000 as<br />
presented in the Figures and to identify specific and general points.<br />
5.1 LCMGB and LCM2000 (Figure 1 and Figure 2)<br />
LCMGB was very much a scientific exercise; in 2000 there is a marked increase<br />
in the complexity <strong>of</strong> the network and the influence <strong>of</strong> various actors. The<br />
overriding themes are: the increased influence <strong>of</strong> policy, consultation with<br />
previous and future users and their influence over the new methodology. In 1990<br />
the steering group is not a significant actor but in LCM2000 it was much more<br />
active as a forum for decision-making. Potentially differing interests among the<br />
users were mediated through the concept <strong>of</strong> Broad Habitats, which are<br />
represented here as part <strong>of</strong> the 2000 Methodology. A noteworthy similarity is<br />
that the field survey still provides the only measures <strong>of</strong> data quality for the<br />
LCM2000 product.<br />
Compared to LCMGB there are more significant actors in LCM2000: the role <strong>of</strong><br />
the Earth Observation Section is less central, the Methodology and the Steering<br />
Group are more central, LCMGB becomes an actor while satellite imagery is no<br />
longer part <strong>of</strong> the network <strong>of</strong> actors. (One <strong>of</strong> the aims <strong>of</strong> LCMGB was to<br />
demonstrate the utility <strong>of</strong> satellite imagery for mapping land cover, hence its<br />
depiction as an actor in 1990. By the time <strong>of</strong> commissioning LCM2000,<br />
acceptance <strong>of</strong> the paradigm <strong>of</strong> land cover mapping from satellite imagery is<br />
sufficiently widespread for its use to be uncontroversial and whilst it is still an<br />
actor it is not a central one and for clarity has been omitted from the diagram.)<br />
The links between actors in 2000 is more complex: money is coming from more<br />
sources requiring greater accountability, policy has a strong influence, users<br />
10
influence the Methodology, formal control is far more prevalent, there is greater<br />
Information exchange between actors.<br />
By comparing the differences between the two figures (1 and 2) we can easily<br />
see the different drivers and pressures coming to play in the production <strong>of</strong><br />
LCM2000. The actors represented in the network are the main ones, it does not<br />
show or consider the role <strong>of</strong> other actors such as the notion <strong>of</strong> acceptable<br />
accuracy, nor <strong>of</strong> individual people who may have exerted influence such as<br />
Pr<strong>of</strong>s Roy Haines-Young (<strong>University</strong> <strong>of</strong> Nottingham) and Mike Roberts<br />
(Director <strong>of</strong> ITE/CEH).<br />
5.2 LCMGB and FS1990 (Figure 1 and Figure 3)<br />
There are many similarities between the actor-networks <strong>of</strong> FS1990 and LCMGB.<br />
The raw data, satellite imagery and field data, and established scientific<br />
methodology are significant actors for both projects. They differ in the strength<br />
<strong>of</strong> the previous methodology and in the control exercised over the LCMGB<br />
results by FS1990 through the validation process.<br />
5.3 LCM2000 and FS2000 (Figure 2 and Figure 4)<br />
The increased influence <strong>of</strong> policy and the users over the final land cover product<br />
is in evidence for both LCM2000 and FS2000, increasing the number <strong>of</strong> actors<br />
and new methodologies. The influence <strong>of</strong> previous methodologies is stronger in<br />
the FS2000 network, as the changes in methodology were small relative to the<br />
dramatic changes in the land cover map methodology. ECOFACT makes a clear<br />
link between FS2000 and Policy, whilst in LCM2000, this link is more diffuse,<br />
running through the Agencies / Users, the LCM2000 Steering Group and the new<br />
methodology to the final LCM2000 product.<br />
5.4 FS1990 and FS2000 (Figure 3 and Figure 4)<br />
The major differences are the increased influence <strong>of</strong> Policy and the role <strong>of</strong> the<br />
Scoping Report (Haines-Young and Swanwick, 2000) to address the policy<br />
issues. Here the Scoping Report is the link between the government and the<br />
producers <strong>of</strong> FS2000. In 2000 there is much less <strong>of</strong> a link between scientific<br />
practice, as represented by ―Ecological Science‖ and ―Previous field survey<br />
Methodology‖ in 1990. Instead, the influence <strong>of</strong> policy and user demands comes<br />
together with FS1990 Methodology in the tweaked FS2000 methodology.<br />
From this comparison <strong>of</strong> the two field surveys (Figures 3 and 4) it can be seen<br />
that the context within which the field survey was conducted had also changed<br />
significantly. The methodology from previous surveys is no longer an<br />
accountable actor, rather it can be seen as a legacy informing current practice.<br />
The DEFRA relationship with CEH is much less direct in the 2000 survey,<br />
reflecting the increased political role and statutory responsibility <strong>of</strong> the<br />
environmental agencies.<br />
5.5 General Points<br />
Using ANT to characterise the Countryside Surveys 1990 and 2000 and the way<br />
they were commissioned is revealing. It clearly illustrates the changed political<br />
world within which science is commissioned: direct links to government are<br />
weaker as responsibility for different spheres <strong>of</strong> interest (such environmental<br />
monitoring) is decentralised away from the various ministries into independent<br />
agencies.<br />
In CS1990 the scientists determined the reporting categories for the field survey<br />
and the land cover map and identified the scientific questions that could be<br />
answered by the data. Necessarily this was robust science, developing and<br />
extending an existing methodology. In CS2000 dialogue with stakeholders<br />
11
started early and their role was formalised through a steering group, the Scoping<br />
report (Haines-Young & Swanwick 2000) and work such as ECOFACT (Bunce<br />
et al., 1999). This led to an enlarged user community (and funders) it also<br />
increased the number <strong>of</strong> (potentially) conflicting objectives. Information to meet<br />
the needs <strong>of</strong> Government and International policies increased dramatically<br />
between the two dates. For CS2000 the users were consulted before, during and<br />
after production <strong>of</strong> land cover information, they were also allowed to inform,<br />
guide and control the methodology used. The Scoping Study (Haines-Young and<br />
Swanwick, 2000) was able to present a case for the commissioning <strong>of</strong> CS2000<br />
whilst advising the government on what questions it was possible to answer. This<br />
reflects the changed political world (devolved responsibility in the hands <strong>of</strong> the<br />
agencies) and the influence <strong>of</strong> international legislation and agreements—actors<br />
not directly included in this analysis. These two factors have combined to<br />
significantly change the questions for which answers are being sought by<br />
initiatives like the Countryside Survey. The degree to which these additional<br />
requirements have and could be met is still an open question.<br />
In this analysis we applied the structural framework developed by Martin (2000)<br />
to illustrate the actors and the networks <strong>of</strong> conservation bodies in Ecuador.<br />
Martin examined the different networks in Ecuador by the flows <strong>of</strong> money,<br />
control, information and skills. We have shown this approach to be relevant for a<br />
comparison <strong>of</strong> the CS1990 and CS2000 networks and a useful method for<br />
describing their different scientific and policy contexts. This validates the<br />
descriptive potential Martin‘s approach and indicates its applicability to other<br />
land use policy arenas in the UK or internationally. It builds on the work <strong>of</strong><br />
Harvey and Chrisman (1998) who considered the different ways that wetlands<br />
were constructed by different agencies as well as that <strong>of</strong> Martin (2000).<br />
Another theme that emerges from this analysis is the acceptance <strong>of</strong> measures <strong>of</strong><br />
remotely sensed land cover map quality through correspondence with a field<br />
survey. After CS1990 there was much work examining differences between the<br />
field and satellite data and the specific integration problems (nomenclatures,<br />
timing, spatial and statistical) described in Section 2. Overcoming these problems<br />
formed the basis <strong>of</strong> the recommendations for the future Countryside Survey<br />
update in 1998–2000 (CS2000). It is interesting to note that Fuller et al. (1998)<br />
commented on the complex interactions between scale and resolution <strong>of</strong> the data<br />
and for cartography at different scales: ―there is likely to be inconsistency if one<br />
is used to validate the other‖ (Fuller et al., 1998: p123). Such inconsistency is<br />
inevitable. Further, they conclude their paper by stating: ―A planned update in<br />
1998–2000 will address many <strong>of</strong> the problems <strong>of</strong> the Countryside Survey 1990,<br />
upgrade the detail and accuracy and will ensure even closer integration between<br />
the field and satellite surveys‖ (Fuller et al., 1998: p125). Unfortunately, the<br />
methodological differences were not fully resolved in CS2000. However, in<br />
terms <strong>of</strong> ANT, the validation <strong>of</strong> the land cover map by the field survey in 2000<br />
has gained the status <strong>of</strong> one <strong>of</strong> Latour‘s black boxes: it has become an accepted<br />
paradigm <strong>of</strong> data quality reporting.<br />
We are aware that we have only documented the process <strong>of</strong> evolution from<br />
CS1990 to CS2000, reflecting our interest in how differences between field<br />
survey and satellite land cover might have been resolved. However the field<br />
survey component <strong>of</strong> the Countryside Survey series has a much longer and varied<br />
history. A more specific analysis <strong>of</strong> the evolution <strong>of</strong> the fields survey series may<br />
provide a revealing insight in to the way that scientific enquiry has changed: for<br />
12
instance, the move away from self-tasked initiatives by scientists to a situation<br />
where scientists are contractors. However, this would require access to<br />
information about the field surveys <strong>of</strong> 1978 and 1984 (texts, reports, minutes <strong>of</strong><br />
meetings, personnel, etc.), and was beyond the scope <strong>of</strong> our specific interests.<br />
A final criticism that may be levelled at this sort <strong>of</strong> analysis concerns the<br />
certainty with which a retrospective study adequately captures reality 10 years<br />
ago. Generally, scientific activity today seeks to make its results more responsive<br />
to the needs <strong>of</strong> society. Further, here in this work we have characterised the<br />
contexts for the CS1990 land cover mapping exercises by a stronger scientific<br />
influence and weaker policy influence than equivalent products today. The<br />
accusation <strong>of</strong> self-fulfilling scientific prophesy can be countered by considering a<br />
number <strong>of</strong> activities and legislation in the policy arena today that are concerned<br />
with land cover mapping. Ten years ago there were few, now there are many.<br />
There exists a wider consensus in society today about environmental issues<br />
compared to ten years ago: the (scientific) world is different. We document that<br />
as well as reflect it.<br />
6. Conclusions<br />
ANT approaches scientific endeavour from a sociological perspective. <strong>Network</strong>s<br />
describe people and institutions, artefacts and entities that have different spheres<br />
<strong>of</strong> influence including the design <strong>of</strong> the new technology, its diffusion and its<br />
operation. This type <strong>of</strong> analysis provides a frame with which to represent the<br />
individual and institutional views <strong>of</strong> those involved in commissioning a land<br />
cover mapping exercise. Applying Martin‘s (2000) schema to describe the<br />
commissioning the Countryside Surveys <strong>of</strong> 1990 and 2000 <strong>of</strong>fers an interesting<br />
overview <strong>of</strong> the process. This is different than would be obtained if only the<br />
scientific elements were considered, as the networks described in this work<br />
contain actors who are not usually considered when scientific products are<br />
evaluated.<br />
Changes in the context within which the two datasets were commissioned are<br />
clearly illustrated in this process: the network <strong>of</strong> actors and the nature <strong>of</strong> the<br />
influence they have over the final product are seen when their interlocking<br />
networks are drawn. ANT as model allows the detail <strong>of</strong> scientific debates to be<br />
examined, and shows actor-network theory able to incorporate evidence from a<br />
variety <strong>of</strong> sources.<br />
The analysis <strong>of</strong> the differences in the networks describing CS1990 and CS2000<br />
provides a useful tool to those seeking to reconcile ontological and semantic<br />
differences between the surveys. Understanding the origins <strong>of</strong> the datasets and<br />
their construction casts a light on the different questions that are being answered<br />
by the data both across time (1990 to 2000) and across different methodologies<br />
(field survey and satellite land cover map). In 1990 the field survey reported land<br />
cover stock in terms <strong>of</strong> 59 Reporting Classes and the Land Cover Map using 25<br />
Target classes. In CS2000, they both report in terms <strong>of</strong> similarly defined Broad<br />
Habitats, which were only formalised by JNCC only months before the first<br />
results were announced.<br />
ANT describes the various networks and allies involved in the creation and<br />
commissioning <strong>of</strong> science. It illustrates the workings behind the derivation <strong>of</strong><br />
scientific results and the process by which empirical facts are established. ANT<br />
has proved to be useful tool for highlighting the specific differences that need to<br />
be addressed by any formal approach to reconciling data with different<br />
ontological pedigree.<br />
13
Acknowledgements<br />
This paper would not have been possible without the co-operation <strong>of</strong> a number <strong>of</strong><br />
those involved in commissioning and executing Countryside Survey 2000,<br />
including Robin Fuller, Ge<strong>of</strong>f Smith, Andrew Stott, and Roy Haines-Young. This<br />
paper describes work done within the REVIGIS project funded by the European<br />
Commission, Project Number IST-1999-14189. We wish to thank our partners in<br />
the project, especially Andrew Frank, Robert Jeansoulin, Arko Lucieer, Alfred<br />
Stein, Nic Wilson, Mike Worboys and Barry Wyatt.<br />
7. References<br />
Anderson, C. S., 1996. GIS Development Process: A framework for considering<br />
the initiation, acquisition and incorporation <strong>of</strong> GIS technology. Journal <strong>of</strong> the<br />
Urban and Regional Information Systems Association 8(1), 10–26.<br />
Barr, C.J., 2001. Countryside Survey 2000: Field Handbook Draft 3a. Institute <strong>of</strong><br />
Terrestrial Ecology, unpublished.<br />
Barr, C.J., Bunce, R.G.H., Clarke, R.T., Fuller, R.M., Furze, M.T., Gillespie, M.K.,<br />
Groom, G.B., Hallam, C.J., Hornung, M., Howard, D.C., Ness, M.J., 1993.<br />
Countryside Survey 1990: main report. Countryside 1990 Series: Volume 2.<br />
Department <strong>of</strong> the Environment, London.<br />
Bishr, Y., 1998. Overcoming the semantic and other barriers to GIS<br />
interoperability. International Journal <strong>of</strong> Geographical Information Science 2(4),<br />
299–314.<br />
Bowker G.C. 2000. Mapping biodiversity. International Journal <strong>of</strong> Geographical<br />
Information Science 14 (8), 739-754.<br />
Bunce, R. G. H., Barr, C. J., Gillespie, M. K., Howard, D. C., Scott, W. A.,<br />
Smart, S. M., van de Poll, H. M., Watkins, J. W., 1999. ECOFACT 1 –<br />
Vegetation <strong>of</strong> the British Countryside. London, HMSO.<br />
Bunce, R.G.H., Heal, O.W., 1984. Landscape evaluation and the impact <strong>of</strong><br />
changing land-use on the rural environment: the problem and an approach. In<br />
Roberts, R.D., Roberts, T.M. (Eds.), Planning and Ecology. Chapman Hall,<br />
London, pp. 164–188.<br />
Callon, M., 1991. Techno-economic networks and irreversibility. In: Law, J.<br />
(Ed.), A Sociology <strong>of</strong> Monsters: Essays on Power, Technology and Domination.<br />
Routledge, London, pp. 132–161.<br />
Cherrill, A., McClean, C., 1999a. Between-observer variation in the application<br />
<strong>of</strong> a standard method <strong>of</strong> habitat mapping by environmental consultants in the<br />
UK. Journal <strong>of</strong> Applied Ecology 36(6), 989–1008.<br />
Cherrill, A., McClean, C., 1999b. The reliability <strong>of</strong> 'Phase 1' habitat mapping in<br />
the UK: the extent and types <strong>of</strong> observer bias. Landscape and Urban Planning<br />
45(2–3), 131–143.<br />
Cherrill, A.J., McClean, C., Fuller, R.M., 1995. A comparison <strong>of</strong> land cover<br />
types recognised in an ecological field survey <strong>of</strong> Northern England and in the<br />
first remotely sensed Land Cover Map <strong>of</strong> Great Britain. Biological Conservation<br />
71, 313–323.<br />
Commission <strong>of</strong> the European Communities, 1992. Council Directive 92/43/EEC<br />
<strong>of</strong> 21 May 1992 on the conservation <strong>of</strong> natural habitats and <strong>of</strong> wild fauna and<br />
flora, Official Journal <strong>of</strong> the European Communities, L206.<br />
Frohmann, B., 2001. Taking information policy beyond information science:<br />
applying the actor network theory.<br />
http://www.ualberta.ca/dept/slis/cais/frohmann.htm [available, 30/10/01].<br />
14
Fuller, R.M., Groom, G.B., Jones, A.R., 1994. The Land Cover Map <strong>of</strong> Great<br />
Britain: an automated classification <strong>of</strong> Landsat Thematic Mapper data.<br />
Photogrammetric Engineering and Remote Sensing 60, 553–562.<br />
Fuller, R.M., Smith, G.M., Sanderson, J.M., Hill, R.A., Thomson, A.G., 2002.<br />
Land Cover Map 2000: construction <strong>of</strong> a parcel-based vector map from satellite<br />
images. The Cartographic Journal 30(1), 15–25.<br />
Fuller, R.M., Wyatt, B.K., Barr, C.J., 1998. Countryside survey from ground and<br />
space: different perspectives, complementary results. Journal <strong>of</strong> Environmental<br />
Management 54(2), 101–126.<br />
Gruber, T.R. 1993. A translation approach to portable ontology specifications.<br />
Knowledge Acquisition 5(2), 199–220.<br />
Haines-Young, R.H., Swanwick, C., 1996. Scoping study for Countryside Survey<br />
2000 (Part A) First Interim Report to Department <strong>of</strong> the Environment. <strong>University</strong><br />
<strong>of</strong> Nottingham, Nottingham.<br />
Haines-Young, R.H., Swanwick, C., 2000. Countryside Survey 2000: Scoping<br />
Study. <strong>University</strong> <strong>of</strong> Nottingham, Nottingham.<br />
Harvey, F., 1997. Improving multi-purpose GIS design: Participative design. In:<br />
Hirtle S. C., Frank A. U. (Eds.), Spatial Information <strong>Theory</strong>: A theoretical Basis<br />
for GIS. Springer, Berlin, pp. 313–328.<br />
Harvey, F., Chrisman, N., 1998. Boundary objects and the social construction <strong>of</strong><br />
GIS technology. Environment and Planning A 30(9), 1683–1694.<br />
Hill, M.O., 1979. TWINSPAN—A FORTRAN program for arranging<br />
multivariate data in an ordered two-way table by classification <strong>of</strong> the individual<br />
attributes. Department <strong>of</strong> Ecology and Systematics, Cornell <strong>University</strong>, Ithaca,<br />
New York.<br />
Jackson, D.L., 2000. JNCC Report No. 307: Guidance on the interpretation <strong>of</strong> the<br />
Biodiversity Broad Habitat Classification (terrestrial and freshwater types):<br />
definitions and the relationships with other habitat classifications. Joint Nature<br />
Conservation Committee, Peterborough.<br />
Latour, B., 1987. Science In Action. Harvard <strong>University</strong> Press, Cambridge.<br />
Law, J., 1992. Notes on the theory <strong>of</strong> the actor-network: ordering, strategy and<br />
heterogeneity. Systems Practice 5(4), 379–393.<br />
Martin, E., 1998. GIS Implementation and the Un-<strong>Theory</strong>: Some useful concepts<br />
from ANT. http://students.washington.edu/~ewmartin/papers/ant511.htm<br />
[available 21/10/01].<br />
Martin, E., 2000. <strong>Actor</strong>-networks and implementation: examples from<br />
conservation GIS in Ecuador. International Journal <strong>of</strong> Geographical Information<br />
Science 14(8), 715–737.<br />
Miettinen, R., 2001. What is <strong>Actor</strong>-<strong>Network</strong> <strong>Theory</strong>?<br />
http://carbon.cudenver.edu/~mryder/itc/act_net_dff.html [available 30/10/01].<br />
Secretariat on the Convention on Biological Diversity, 2000. Sustaining Life on<br />
Earth: How the Convention on Biological Diversity promotes nature and human<br />
well-being. http://www.biodiv.org/doc/publications/cbd-guide-en.pdf [available<br />
13/10/01].<br />
Smith, G.M., Fuller, R.M., 2001. An integrated approach to land cover<br />
classification: an example <strong>of</strong> the island <strong>of</strong> Jersey. International Journal <strong>of</strong> Remote<br />
Sensing 22(16), 3123–3142.<br />
Swanwick, C., Dunn, R. 1996. Countryside Survey 1990: Policy Review.<br />
Countryside Survey Series No 9. DoE, London.<br />
15
Visser, U., Stuckenschmidt, H., Schuster, G., Vögele, T., 2001. Ontologies for<br />
geographic information processing. Computers and Geosciences 28 (1), 103–117<br />
Wyatt, B.K., Greatorex-Davies, N.G., Bunce, R.G.H. Fuller, R.M., Hill, M.O.,<br />
1993. The comparison <strong>of</strong> land cover definitions. Countryside 1990 Series: Volume<br />
3. Department <strong>of</strong> the Environment, London.<br />
16
List <strong>of</strong> Figures<br />
Figure 1. <strong>Network</strong> <strong>of</strong> LCM1990 actors and their links. The nature <strong>of</strong> the links is<br />
indicated by the style <strong>of</strong> the line: money (dash-dot); control (dotted); information<br />
(dashed); skills (solid).<br />
Figure 2. <strong>Network</strong> <strong>of</strong> LCM2000 actors and their links. The nature <strong>of</strong> the links is<br />
indicated by the style <strong>of</strong> the line: money (dash-dot); control (dotted); information<br />
(dashed); skills (solid).<br />
Figure 3. <strong>Network</strong> <strong>of</strong> FS1990 actors and their links. The nature <strong>of</strong> the links is<br />
indicated by the style <strong>of</strong> the line: money (dash-dot); control (dotted); information<br />
(dashed); skills (solid).<br />
Figure 4. <strong>Network</strong> <strong>of</strong> FS2000 actors and their links. The nature <strong>of</strong> the links is<br />
indicated by the style <strong>of</strong> the line: money (dash-dot); control (dotted); information<br />
(dashed); skills (solid).<br />
17
Fig 1<br />
DoE<br />
Remote Sensing<br />
community<br />
BNSC<br />
Satellite Images<br />
1990 field<br />
survey<br />
ITE / CEH EOS<br />
(Monkswood)<br />
Input Accountable <strong>Actor</strong>s<br />
Output<br />
18<br />
LCM1990<br />
Users
Fig 2<br />
ITE EOS / Clevermapping<br />
Agencies /<br />
Users (1990<br />
& 2000)<br />
Laserscan<br />
Policy<br />
DETR / DEFRA<br />
2000 Field survey<br />
LCM1990<br />
Issues<br />
LCM2000<br />
Methodology<br />
LCM2000<br />
Steering Group<br />
Input Accountable <strong>Actor</strong>s Output<br />
19<br />
LCM2000<br />
Users
Fig 3<br />
Ecological<br />
―Science‖<br />
DoE<br />
Users<br />
1990 Field<br />
Survey data<br />
Previous field survey<br />
methodology<br />
ITE / CEH<br />
(Merlewood)<br />
Previous Field<br />
Survey data FS1990<br />
Input Accountable <strong>Actor</strong>s Output<br />
20<br />
Users
Fig 4<br />
Policy<br />
ECOFACT<br />
DETR /<br />
DEFRA<br />
Agencies / Users<br />
(1990 & 2000)<br />
FS1990<br />
methodology<br />
CS2000 Scoping<br />
Report<br />
FS2000<br />
methodology<br />
Input Accountable <strong>Actor</strong>s Output<br />
21<br />
ITE / CEH<br />
(Merlewood)<br />
FS2000<br />
Users