

Talc and Pyrophyllite
Talc and Pyrophyllite
Talc and Pyrophyllite

Create successful ePaper yourself
Turn your PDF publications into a flip-book with our unique Google optimized e-Paper software.
<strong>Talc</strong> <strong>and</strong> <strong>Pyrophyllite</strong><br />
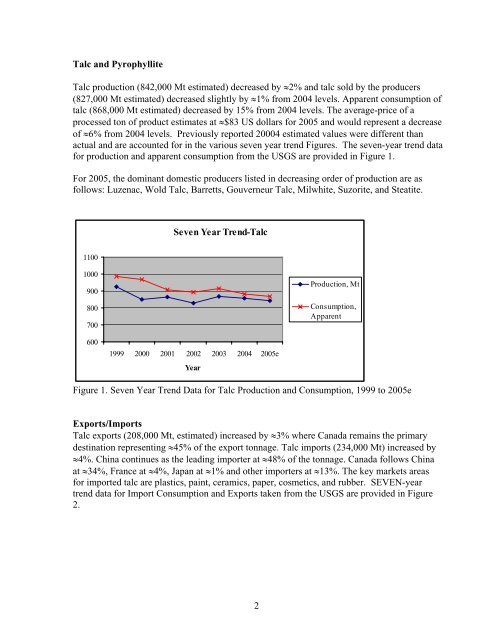
<strong>Talc</strong> production (842,000 Mt estimated) decreased by ≈2% <strong>and</strong> talc sold by the producers<br />
(827,000 Mt estimated) decreased slightly by ≈1% from 2004 levels. Apparent consumption of<br />
talc (868,000 Mt estimated) decreased by 15% from 2004 levels. The average-price of a<br />
processed ton of product estimates at ≈$83 US dollars for 2005 <strong>and</strong> would represent a decrease<br />
of ≈6% from 2004 levels. Previously reported 20004 estimated values were different than<br />
actual <strong>and</strong> are accounted for in the various seven year trend Figures. The seven-year trend data<br />
for production <strong>and</strong> apparent consumption from the USGS are provided in Figure 1.<br />
For 2005, the dominant domestic producers listed in decreasing order of production are as<br />
follows: Luzenac, Wold <strong>Talc</strong>, Barretts, Gouverneur <strong>Talc</strong>, Milwhite, Suzorite, <strong>and</strong> Steatite.<br />
1100<br />
1000<br />
900<br />
800<br />
700<br />
600<br />
Seven Year Trend-<strong>Talc</strong><br />
1999 2000 2001 2002 2003 2004 2005e<br />
Year<br />
Production, Mt<br />
Consumption,<br />
Apparent<br />
Figure 1. Seven Year Trend Data for <strong>Talc</strong> Production <strong>and</strong> Consumption, 1999 to 2005e<br />
Exports/Imports<br />
<strong>Talc</strong> exports (208,000 Mt, estimated) increased by ≈3% where Canada remains the primary<br />
destination representing ≈45% of the export tonnage. <strong>Talc</strong> imports (234,000 Mt) increased by<br />
≈4%. China continues as the leading importer at ≈48% of the tonnage. Canada follows China<br />
at ≈34%, France at ≈4%, Japan at ≈1% <strong>and</strong> other importers at ≈13%. The key markets areas<br />
for imported talc are plastics, paint, ceramics, paper, cosmetics, <strong>and</strong> rubber. SEVEN-year<br />
trend data for Import Consumption <strong>and</strong> Exports taken from the USGS are provided in Figure<br />
2.<br />
2