Ficha Comercial de la Unión Europea, Secretaría de Economía
Ficha Comercial de la Unión Europea, Secretaría de Economía
Ficha Comercial de la Unión Europea, Secretaría de Economía

You also want an ePaper? Increase the reach of your titles
YUMPU automatically turns print PDFs into web optimized ePapers that Google loves.
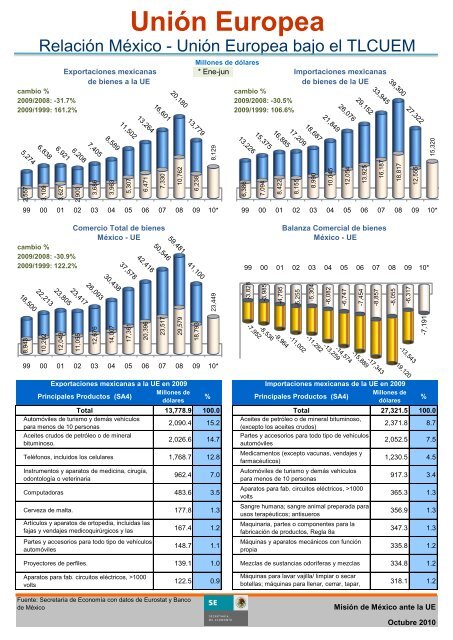
<strong>Unión</strong> <strong>Europea</strong><br />
Re<strong>la</strong>ción México - <strong>Unión</strong> <strong>Europea</strong> bajo el TLCUEM<br />
Exportaciones mexicanas<br />
Millones <strong>de</strong> dó<strong>la</strong>res<br />
* Ene-jun Importaciones mexicanas<br />
<strong>de</strong> bienes a <strong>la</strong> UE <strong>de</strong> bienes <strong>de</strong> <strong>la</strong> UE<br />
cambio % cambio %<br />
2009/2008: -31.7% 2009/2008: -30.5%<br />
2009/1999: 161.2% 2009/1999: 106.6%<br />
2,557<br />
99 00 01 02 03 04 05 06 07 08 09 10*<br />
Comercio Total <strong>de</strong> bienes<br />
Ba<strong>la</strong>nza <strong>Comercial</strong> <strong>de</strong> bienes<br />
México - UE México - UE<br />
cambio %<br />
2009/2008: -30.9%<br />
2009/1999: 122.2%<br />
99 00 01 02 03 04 05 06 07 08 09 10*<br />
8,943<br />
3,109<br />
10,202<br />
3,627<br />
12,049<br />
2,900<br />
11,055<br />
3,686<br />
12,676<br />
Exportaciones mexicanas a <strong>la</strong> UE en 2009 Importaciones mexicanas <strong>de</strong> <strong>la</strong> UE en 2009<br />
Principales Productos (SA4)<br />
Millones <strong>de</strong><br />
dó<strong>la</strong>res<br />
% Principales Productos (SA4)<br />
Millones <strong>de</strong><br />
dó<strong>la</strong>res<br />
Total 13,778.9 100.0 Total 27,321.5 100.0<br />
Automóviles <strong>de</strong> turismo y <strong>de</strong>más vehículos<br />
para menos <strong>de</strong> 10 personas<br />
Aceites crudos <strong>de</strong> petróleo o <strong>de</strong> mineral<br />
bituminoso.<br />
2,090.4 15.2<br />
2,026.6 14.7<br />
Teléfonos, incluidos los celu<strong>la</strong>res 1,768.7 12.8<br />
Instrumentos y aparatos <strong>de</strong> medicina, cirugía,<br />
odontología o veterinaria<br />
962.4 7.0<br />
Computadoras 483.6 3.5<br />
Cerveza <strong>de</strong> malta. 177.8 1.3<br />
Artículos y aparatos <strong>de</strong> ortopedia, incluidas <strong>la</strong>s<br />
fajas y vendajes medicoquirúrgicos y <strong>la</strong>s<br />
l t t blill fé l<br />
Partes y accesorios para todo tipo <strong>de</strong> vehículos<br />
automóviles<br />
167.4 1.2<br />
148.7 1.1<br />
Aceites <strong>de</strong> petróleo o <strong>de</strong> mineral bituminoso,<br />
(excepto los aceites crudos)<br />
Partes y accesorios para todo tipo <strong>de</strong> vehículos<br />
automóviles<br />
Medicamentos (excepto vacunas, vendajes y<br />
farmacéuticos)<br />
Automóviles <strong>de</strong> turismo y <strong>de</strong>más vehículos<br />
para menos <strong>de</strong> 10 personas<br />
Aparatos para fab. circuitos eléctricos, >1000<br />
volts<br />
Sangre humana; sangre animal preparada para<br />
usos terapéuticos; antisueros<br />
Maquinaria, partes o componentes para <strong>la</strong><br />
fabricación <strong>de</strong> productos, Reg<strong>la</strong> 8a<br />
Máquinas y aparatos mecánicos con función<br />
propia<br />
%<br />
2,371.8 8.7<br />
2,052.5 7.5<br />
1,230.5 4.5<br />
917.3 3.4<br />
365.3 1.3<br />
356.9 1.3<br />
347.3 1.3<br />
335.8 1.2<br />
Proyectores <strong>de</strong> perfiles. 139.1 1.0 Mezc<strong>la</strong>s <strong>de</strong> sustancias odoríferas y mezc<strong>la</strong>s 334.8 1.2<br />
Aparatos para fab. circuitos eléctricos, >1000<br />
volts<br />
Fuente: <strong>Secretaría</strong> <strong>de</strong> <strong>Economía</strong> con datos <strong>de</strong> Eurostat y Banco<br />
<strong>de</strong> México<br />
3,963<br />
14,007<br />
99 00 01 02 03 04 05 06 07 08 09 10*<br />
5,307<br />
17,361<br />
6,471<br />
20,396<br />
7,330<br />
23,517<br />
10,762<br />
29,579<br />
6,238<br />
18,793<br />
8,129<br />
23,449<br />
122.5 0.9<br />
6,386<br />
7,094<br />
8,422<br />
8,155<br />
8,990<br />
10,045<br />
99 00 01 02 03 04 05 06 07 08 09 10*<br />
-3,828<br />
-3,985<br />
-4,795<br />
-5,255<br />
-5,304<br />
-6,082<br />
12,054<br />
-6,747<br />
Máquinas para <strong>la</strong>var vajil<strong>la</strong>/ limpiar o secar<br />
botel<strong>la</strong>s; máquinas para llenar, cerrar, tapar,<br />
t ti t b t ll<br />
13,925<br />
-7,454<br />
-8,857<br />
16,187<br />
-8,055<br />
18,817<br />
-6,317<br />
12,555<br />
-7,191<br />
15,320<br />
318.1 1.2<br />
Misión <strong>de</strong> México ante <strong>la</strong> UE<br />
Octubre 2010
Millones <strong>de</strong> dó<strong>la</strong>res<br />
Comercio <strong>de</strong> bienes <strong>de</strong> México con <strong>la</strong> UE en 2009<br />
<strong>Unión</strong> <strong>Europea</strong><br />
Re<strong>la</strong>ción México - <strong>Unión</strong> <strong>Europea</strong> bajo el TLCUEM<br />
Exp. % Imp. % País Exp. % País Imp. %<br />
Sector (SITC) 13,779 100 27,322 100 Alemania 3,855.1 28.0 Alemania 9,727.3 35.6<br />
Prod. alimenticios y animales<br />
vivos<br />
652 4.7 347 1.3<br />
España<br />
Países Bajos<br />
2,551.7<br />
1,809.2<br />
18.5<br />
13.1<br />
Italia<br />
España<br />
3,146.7<br />
3,004.0<br />
11.5<br />
11.0<br />
Bebidas y tabacos<br />
273 2.0 340 1.2<br />
Reino Unido<br />
Bélgica<br />
1,586.7<br />
1,323.8<br />
11.5<br />
9.6<br />
Francia<br />
Países Bajos<br />
2,502.5<br />
2,170.9<br />
9.2<br />
7.9<br />
Materiales crudos no<br />
comestibles, excepto los<br />
292 2.1 297 1.1<br />
Italia<br />
Francia<br />
698.9<br />
645.2<br />
5.1<br />
4.7<br />
Reino Unido<br />
Ir<strong>la</strong>nda<br />
1,837.8<br />
812.9<br />
6.7<br />
3.0<br />
Combustibles y lubricantes<br />
minerales y productos conexos<br />
2,055 14.9 2,396 8.8<br />
Ir<strong>la</strong>nda<br />
Hungría<br />
217.1<br />
188.9<br />
1.6<br />
1.4<br />
Suecia<br />
Bélgica<br />
695.7<br />
612.6<br />
2.5<br />
2.2<br />
Aceites, grasas y ceras <strong>de</strong><br />
origen animal y vegetal<br />
13 0.1 47 0.2<br />
Fin<strong>la</strong>ndia<br />
Suecia<br />
104.9<br />
101.2<br />
0.8<br />
0.7<br />
Austria<br />
Dinamarca<br />
464.4<br />
371.6<br />
1.7<br />
1.4<br />
Productos químicos y productos<br />
conexos, n.e.p.<br />
864 6.3 5,227 19.1<br />
Dinamarca<br />
Polonia<br />
94.5<br />
84.8<br />
0.7<br />
0.6<br />
Rep. Checa<br />
Portugal<br />
318.5<br />
296.6<br />
1.2<br />
1.1<br />
Artículos manufacturados,<br />
c<strong>la</strong>sificados principalmente<br />
635 4.6 3,594 13.2<br />
Checa<br />
Portugal<br />
78.4<br />
76.0<br />
0.6<br />
0.6<br />
Fin<strong>la</strong>ndia<br />
Hungría<br />
285.7<br />
275.6<br />
1.0<br />
1.0<br />
Maquinaria y equipo <strong>de</strong><br />
transporte<br />
6,695 48.6 12,038 44.1<br />
Austria<br />
Luxemburgo<br />
74.8<br />
74.7<br />
0.5<br />
0.5<br />
Polonia<br />
Malta<br />
244.7<br />
108.9<br />
0.9<br />
0.4<br />
Artículos manufacturados<br />
diversos<br />
1,835 13.3 2,461 9.0<br />
Grecia<br />
Rumania<br />
71.0<br />
64.9<br />
0.5<br />
0.5<br />
Rumania<br />
Luxemburgo<br />
70.1<br />
66.3<br />
0.3<br />
0.2<br />
Mercancías y operaciones no<br />
c<strong>la</strong>sificadas en otros rubros<br />
461 3.3 576 2.1<br />
Lituania<br />
Eslovaquia<br />
29.8<br />
16.5<br />
0.2<br />
0.1<br />
Eslovaquia<br />
Lituania<br />
58.2<br />
57.3<br />
0.2<br />
0.2<br />
Eslovenia 10.0 0.1 Eslovenia 54.5 0.2<br />
Bulgaria 6.0 0.0 Grecia 52.7 0.2<br />
Chipre 5.3 0.0 Estonia 33.8 0.1<br />
Estonia 2.8 0.0 Bulgaria 25.6 0.1<br />
Letonia 2.0 0.0 Letonia 4.6 0.0<br />
Malta 1.2 0.0 Chipre 0.3 0.0<br />
No i<strong>de</strong>ntificado 21.5 0.1<br />
TOTAL UE 13,779<br />
Principales socios comerciales <strong>de</strong> <strong>la</strong> UE en 2009<br />
Exportaciones Importaciones<br />
100 TOTAL UE 27,322<br />
Millones <strong>de</strong><br />
Millones <strong>de</strong><br />
País % País %<br />
dó<strong>la</strong>res<br />
dó<strong>la</strong>res<br />
1 Estados Unidos 285,373 18.7 1 China 299,381<br />
2 Suiza 123,571 8.1 2 Estados Unidos 222,861<br />
3 China 113,908 7.4 3 Rusia 160,971<br />
4 Rusia 91,591 6.0 4 Suiza 102,878<br />
5 Turquía 61,212 4.0 5 Noruega 95,827<br />
6 Noruega 52,434 3.4 6 Japón 77,850<br />
7 Japón 50,185 3.3 7 Turquía 50,329<br />
8 India 38,390 2.5 8 Corea <strong>de</strong>l Sur 44,682<br />
9 Emiratos Arabes 35,084 2.3 9 Brasil 35,729<br />
10 Canadá 31,296 2.0 10 India 35,406<br />
18 México 22,124 1.4 23 México 13,779<br />
Total 1,529,053 100 Total 1,673,298<br />
Fuente: <strong>Secretaría</strong> <strong>de</strong> <strong>Economía</strong> con datos <strong>de</strong> Eurostat y Banco <strong>de</strong> México<br />
17.9<br />
13.3<br />
9.6<br />
6.1<br />
5.7<br />
4.7<br />
3.0<br />
2.7<br />
2.1<br />
2.1<br />
0.8<br />
100<br />
100<br />
2
Millones <strong>de</strong> dó<strong>la</strong>res<br />
IED Acumu<strong>la</strong>da (1999-2010 jun) IED por Sectores<br />
Flujo anual Sector<br />
promedio<br />
7,499.5<br />
99 00 01 02 03 04 05 06 07 08 09 10*<br />
IED por países<br />
<strong>Unión</strong> <strong>Europea</strong><br />
Inversión Extranjera Directa <strong>de</strong> <strong>la</strong> UE en México<br />
Valor %<br />
Núm. <strong>de</strong><br />
empresas<br />
%<br />
# Emp.<br />
Industria manufacturera 36,256 39.9 2,384 22.9<br />
Servicios Financieros 24,501 27.0 1,406 13.5<br />
Rest.-Hoteles, Serv. Prof. 12,009 13.2 3,422 32.9<br />
Transportes y comunicaciones 7,404 8.2 163 1.6<br />
Comercio 4,103 4.5 2,311 22.2<br />
Construcción 3,564 3.9 489 4.7<br />
Electricidad y agua 2,127 2.3 109 1.0<br />
Minería y extracción 859 0.9 75 0.7<br />
Agricultura 15 0.0 51 0.5<br />
No asignado 1 0.0<br />
País IED % IED por Ramas<br />
Total 90,837 100 10,411 100<br />
1 España 38,120.2 42.0 Ramas %<br />
2 Países Bajos 33,476.2 36.9 Serv. <strong>de</strong> inst. crediticias, bancarias y aux. crédito. 20.8<br />
3 Reino Unido 7,071.0 7.8 Prestación <strong>de</strong> serv. profesionales, técnicos y especializados. E<br />
4 Alemania 4,550.6 5.0 Comunicaciones. 7.1<br />
5 Luxemburgo 1,837.9 2.0 Industria <strong>de</strong> <strong>la</strong>s bebidas 6.6<br />
6 Dinamarca 1,427.6 1.6 Industria automotriz. 5.5<br />
7 Bélgica 1,363.2 1.5 E<strong>la</strong>b. otros prod. alimenticios consumo humano 4.4<br />
8 Suecia 1,149.0 1.3 Industria básica <strong>de</strong>l hierro y <strong>de</strong>l acero. 4.4<br />
9 Fin<strong>la</strong>ndia 561.1 0.6 Comercio <strong>de</strong> prod. no alimenticios al por mayor. Inc. alimentos 3.0<br />
10 Italia 546.9 0.6 Electricidad. 2.3<br />
11 Ir<strong>la</strong>nda 373.6 0.4 Fab. <strong>de</strong> sustancias químicas básicas. Exc. <strong>la</strong>s petroquímicas bá 2.1<br />
12 Francia 180.3 0.2 Serv. <strong>de</strong> instituciones <strong>de</strong> seguros y fianzas. 2.1<br />
13 Austria 124.4 0.1 Fabricación <strong>de</strong> otras sustancias y prod. químicos. 2.0<br />
14 Portugal 24.6 0.0 Serv. <strong>de</strong> inst. financieras <strong>de</strong>l mercado <strong>de</strong> valores. 1.8<br />
15 Polonia 15.6 0.0 Fab. Computadoras y máquinas <strong>de</strong> oficina 1.8<br />
16 República Checa 10.2 0.0 Industria <strong>de</strong>l tabaco 1.7<br />
17 Hungría 1.6 0.0 Manufactura <strong>de</strong> celulosa, papel y sus productos. 1.6<br />
18 Chipre 1.3 0.0 Otras construcciones. 1.5<br />
19 Lituania 1.1 0.0 Otros servicios inmobiliarios. 1.5<br />
20 Grecia 0.6 0.0 Fab. <strong>de</strong> equipo electrónico <strong>de</strong> radio, tv, comunicaciones 1.4<br />
21 Bulgaria 0.2 0.0 Comercio <strong>de</strong> prod. alimenticios en supermercados, tiendas <strong>de</strong> a 1.2<br />
22 Eslovaquia 0.2 0.0 Transporte aéreo. 1.1<br />
23 Eslovenia - 0.0 Fab. <strong>de</strong> maq., equipo y accesorios eléctricos. 1.0<br />
24 Estonia - 0.0 Extrac. <strong>de</strong> minerales metálicos no ferrosos 0.9<br />
25 Letonia - 0.0 Servicios re<strong>la</strong>cionados con el transporte aéreo. 0.8<br />
26 Malta - 0.0 Construcción <strong>de</strong> obras <strong>de</strong> urbanización. 0.8<br />
27 Rumania - 0.0 Otras ramas 12.5<br />
TOTAL UE27 90,837 100 TOTAL 100<br />
Fuente: <strong>Secretaría</strong> <strong>de</strong> <strong>Economía</strong><br />
9.9<br />
3
Exportaciones mexicanas<br />
<strong>de</strong> servicios a <strong>la</strong> UE<br />
Millones <strong>de</strong> euros<br />
<strong>Unión</strong> <strong>Europea</strong><br />
Comercio <strong>de</strong> Servicios México - <strong>Unión</strong> <strong>Europea</strong><br />
cambio % 2008/1999: 102% Millones<br />
Cuenta Corriente Servicios <strong>de</strong> euros %<br />
99 00 01 02 03 04 05 06 07 08<br />
Importaciones mexicanas<br />
<strong>de</strong> servicios originarias <strong>de</strong> <strong>la</strong> UE<br />
Total 3,267.4 100<br />
Viajes 1,652.5 50.6<br />
Transportes 744.9 22.8<br />
Servicios profesionales y otros negocios 566.6 17.3<br />
Construcción 87.1 2.7<br />
Tecnología <strong>de</strong> <strong>la</strong> Información 51.5 1.6<br />
Comunicaciones 47.4 1.5<br />
Financieros 38.5 1.2<br />
cambio % 2008/1999: 185% Seguros 24.3 0.7<br />
Gobierno 23.9 0.7<br />
Derechos <strong>de</strong> patentes y franquicias 12.7 0.4<br />
Personales, culturales y recreativos 10.1 0.3<br />
No c<strong>la</strong>sificados (inc. comercio confi<strong>de</strong>ncial) 7.9 0.2<br />
99 00 01 02 03 04 05 06 07 08<br />
Comercio Total <strong>de</strong> servicios<br />
Importaciones mexicanas originarias <strong>de</strong> <strong>la</strong> UE<br />
en servicios en 2008<br />
México - UE<br />
Millones<br />
cambio % 2008/1999: 144% Cuenta Corriente Servicios <strong>de</strong> euros %<br />
99 00 01 02 03 04 05 06 07 08<br />
Ba<strong>la</strong>nza <strong>Comercial</strong> <strong>de</strong> servicios<br />
México - UE<br />
99 00 01 02 03 04 05 06 07 08<br />
Fuente: <strong>Secretaría</strong> <strong>de</strong> <strong>Economía</strong> con datos <strong>de</strong> Eurostat.<br />
Nota: Cambio <strong>de</strong> metodología en 2004 **/ incluye comercio confi<strong>de</strong>ncial<br />
Exportaciones mexicanas a <strong>la</strong> UE<br />
en servicios en 2008<br />
Total 4,764.2 100<br />
Servicios profesionales y otros negocios 1,444.2 30.3<br />
Transportes 1,102.1 23.1<br />
Viajes 1,018.2 21.4<br />
Tecnología <strong>de</strong> <strong>la</strong> Información 343.0 7.2<br />
Derechos <strong>de</strong> patentes y franquicias 291.3 6.1<br />
Seguros 239.4 5.0<br />
Financieros 140.4 2.9<br />
Construcción 84.8 1.8<br />
Comunicaciones 38.1 0.8<br />
Personales, culturales y recreativos 35.4 0.7<br />
Gobierno 17.0 0.4<br />
No c<strong>la</strong>sificados (inc. comercio confi<strong>de</strong>ncial) 10.3 0.2<br />
Esta publicación es e<strong>la</strong>borada por <strong>la</strong> Representación <strong>de</strong> <strong>la</strong> <strong>Secretaría</strong> <strong>de</strong> <strong>Economía</strong> en <strong>la</strong> Misión <strong>de</strong> México ante <strong>la</strong> UE.<br />
Av. Franklin Roosevelt 94, 1050, Bruse<strong>la</strong>s, Bélgica. Para mayor información por favor escribanos a: info@economia-bruse<strong>la</strong>s.be,<br />
fax: 32 (02) 644 04 45, o visite nuestro sitio <strong>de</strong> Internet: http://www.economia-bruse<strong>la</strong>s.gob.mx<br />
4